 North Carolina Unemployment Falls
The big headlines here in North Carolina, at least if you’re a republican, is that the unemployment rate has fallen further and faster in North Carolina than anywhere else:
“Federal jobs data shows that North Carolina’s unemployment rate dropped further in one year than any other state in the nation,” Tillis said. “We will continue to implement policies that will enable our citizens to get back to work.”
By itself, the news is good news, heck, even GREAT news. But it rarely is “by itself”:
Economists say the fast drop in the unemployment rate could be because so many people have become discouraged, are giving up on finding a job and are no longer being counted.
The state’s population of working-age adults who are looking for jobs shrank by 111,000 in 2013.
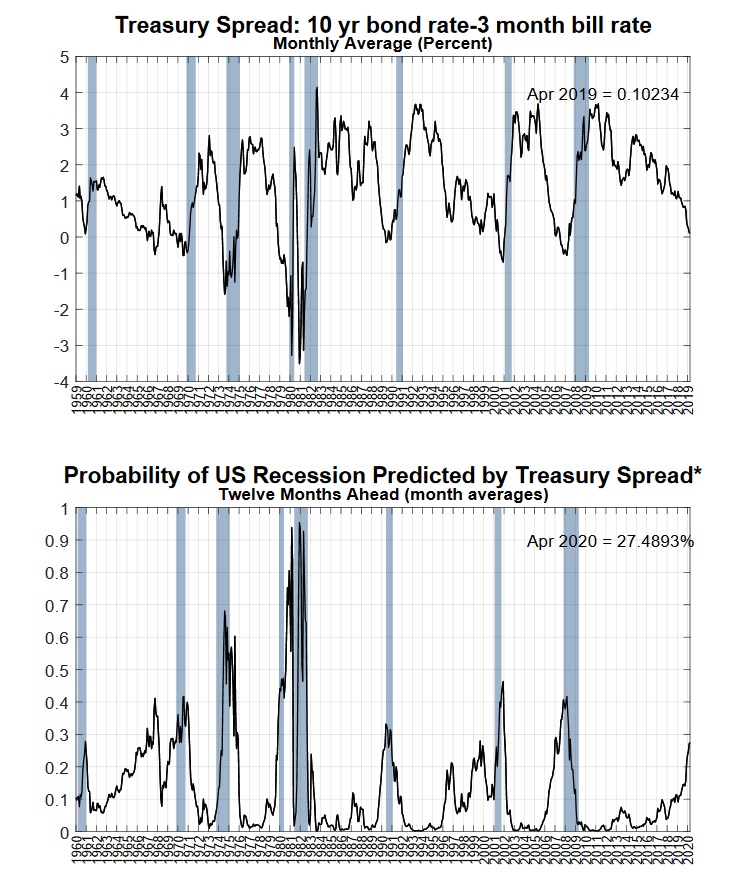
This is, of course, the same phenomenon that nation republicans use to knock Obama. There the big story is that the national labor force participation rate has plummeted to lows that we haven’t seen in decades.
What Do The Numbers Mean
So, what does it mean? Are the policies in North Carolina really working?
Well, first, the policies in North Carolina really describe the new laws regarding how benefits are paid out to unemployed workers here in the Old North State. For example, North Carolina recently revamped the laws that allowed extended benefits to 99 weeks – we now only offer benefits extending up to 20 weeks – much less than the 99 weeks being suggested by the feds.
Now, in my mind, the unemployment insurance is meant as a bridge to sustain an individual during a reasonable job search. And if that search hasn’t produced fruit after 20 weeks, 5 months, the job search needs to be reconsidered and adjusted. But the program should come to an end. The insurance was not created to sustain an out of work individual for perpetuity.
Now, if after the “job search” is over or run its course, that individual in still in need of assistance then other methods should be utilized. And, in North Carolina, that is the case:
A different federal survey that interviews households instead of businesses found the size of North Carolina’s labor force shrunk by 111,000 in 2013.
Where did all those people go? Some died or retired, others left the state and still others may have found other means of financial support, such as a family member.
More people also sought welfare or disability benefits. The number of people using food stamps in North Carolina, for example, surged by nearly 50,000 in October, according to the latest federal figures. The 3.2% spike was the biggest in the nation and was at least twice as large as the increase in every other state except for New Jersey.
So yeah, the unemployment picture isn’t all that the republicans would have us believe it; there are people out there that are struggling. But, BUT, without the extended benefits under the federal version, at least the incentives are in the right place.