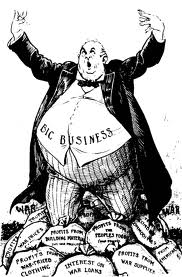
Capitalism And The Rise Of The One Percent
If you aren’t careful, the only thing going on in the world is the rising wealth of the 1% at the expense of the rest of us.
The rich are getting richer while the poor are getting poorer.
Don’t believe it.

If you aren’t careful, the only thing going on in the world is the rising wealth of the 1% at the expense of the rest of us.
The rich are getting richer while the poor are getting poorer.
Don’t believe it.
There’s a bunch of talk about the minimum wage with the recent fast-food protests. People are dismayed that there are jobs that only pay $7.25 an hour and claim that there is no way that you can support a family on that amount of money.
Forget for a second that no one believe you should START a family on $7.25. Forget that a vanishingly small number of people earn the minimum wage and that it is an entry level position where future job skills are learned.
The economics of the thing is what matters.
In a world that has been faced with bone jarring poverty in large swaths of our populations, and with the ever increasing globalization of our economy, it only makes sense that as millions and millions of people enter the “global work force” that competition for jobs increases. And as that occurs, the cost of labor is going to go down.
I’ve never understood the Leftist who complains about the diminished wages of Americans while at the same time bemoaning the poverty of people in Asia, India and Africa.
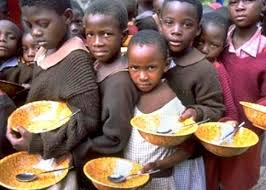
But there is good news. These regions are leaving poverty behind:
AFRICA’s poverty levels are falling by one percentage point per year, with the absolute number of people living below the poverty datum line declining drastically, the World Bank Group has said.
As a result of the impressive economic growth rate, the continent has been posting in the last 10 years, the poverty rate has gone down, while the number of people living below the datum line of US$1.25 per day, has fallen by nine million in three years.
World Bank Group president, Jim Yong Kim said here during the opening session of the fifth Tokyo International Conference on African Development (TICAD V) that, the bank has placed Africa at the core of its effort to end poverty and boost shared prosperity.
He said the growth the continent had recorded in the last 10 years had impacted on the poverty levels.
“The growth has had an impact on poverty – the poverty rate has been falling at one percentage point a year. For the first time, the absolute number of people living below $1.25 a day has fallen – by nine million in three years,” he said.
Soon these places and their people will cease to be “any job at any price” employees and will enter a condition where they will become consumers. They’ll surpass their needs of food and clothing and begin to want the Nikes, the iPads and the Plantations.
(Reuters) – When Wal-Mart Stores the world’s top retailer, bought control of major South African discount chain Massmart Holdings in 2011, American shopping mall developer Irwin Barkan had an epiphany.
An industry veteran of 30 years, Barkan’s U.S. home market was “graying”, while the youthful, underdeveloped African continent offered a sweet spot, with a rapidly expanding middle class and no competition from online retailers.
“When Wal-Mart announced it was buying 51 percent of Massmart, I knew that if I was going to stay in business, Africa was where I had to go,” he said.
He moved last year to Ghana, one of the continent’s brightest economic hopes, and his company, BG International, has broken ground on what will be an 18,400-square-metre (200,000 sq feet) enclosed mall in West Accra. Another mall planned for Ghana’s second city of Kumasi is at a similar stage.
Barkan is not alone. Across Africa, commercial real estate developers are responding to the lure of one of the world’s fastest-growing consumer markets and rushing to build malls for eager retailers.
Consumer spending accounted for more than 60 percent of sub-Saharan Africa’s buoyant economic growth, the World Bank said in its Africa Pulse report in April, adding economic growth would accelerate to more than 5 percent over the next three years, far outpacing the global average.
Africa can be said to be rising. And with it, the wages and hopes and dreams of an entire continent. And as THAT occurs, the downward pressure on wages in America will ease.
So, fellow Americans, take solace in your hearts that a very predictable economic truth is unfolding. As the poorest individuals in the world lurch out of abject poverty, our wages will struggle. But as those poor become consumers, we will recover.
Take solace and rejoice in the power of the economic engine that is capitalism.
Posted in Economics, Liberty, Politics: International
Tagged Africa, Minimum Wage, Poverty
So it just occurred to me.
Why is it that the poor don’t have ID?
Is it an institutional barrier or is it that the same things that result in poverty also cause people not to keep ID on them?
Fix THAT!

I have recently posted on the democrat’s challenge to eat on the average weekly amount of benefits under SNAP – $31.50 – and of the republican’s attempt to meet that challenge.
Nickgb posted over at PYM of his attempt to replicate that attempt here and here.
Then I gave it a college try here. And I hit it:
For $31.50, I have eaten for a week AND included veggies and fruits. Plus I have a small beginning for next week to help me out even further.
But I wanted to see if North Carolina was “average”.
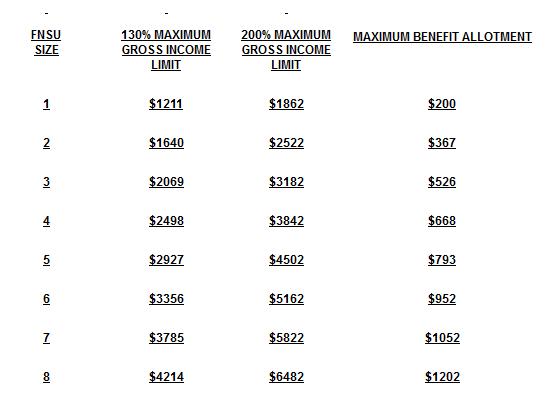
We much more generous than the average as described by the democrats.In fact, an individual can earn up to $14,532 and still qualify for $200 a month. To be sure, 14k a year isn’t much money at all; rent surely would take most of it. But, 50 bucks is a bunch more than $31.50. If I had an extra 20 to spend in my challenge I could almost certainly afford a twelve pack.
Where it gets really interesting, however, is at the 2 household range. There a person can earn $19,680 a year and still qualify for $367.00 a month. In fact, if approved, an individual could earn $30,000 and qualify for that amount.
And if that individual is the mother of a young child?
Again, not the life of luxury and excess. But I’m not sure that most people would support the idea of providing such aid to someone making 20-30k a year if they were asked.
Posted in Economics, Government, Life, Politics: North Carolina
Tagged Food Stamps, Poverty, SNAP, WIC

In considering the many ills that face society, there has been a large focus on the socio-economic status of the family or of the individual in the desire to explain the condition at hand. For example, if a child grows up to become a criminal, we ask, “what was the socio-economic condition of that child or his parents?”
The idea behind this, of course, is that if we can isolate the failure to the economic inequality of society, then we can begin to “fix it” through governmental programs bent on promoting “equality.”
But what if there was another reason why people did the things they do? In this section, I speak about Parenting as discussed in the book, “The Bell Curve.”
In the chapter regarding parenting, the first condition discussed is low birth weight babies. Previously I have shown data that suggests that the SES status of the mother has little bearing on the determination of that condition in children.
But IQ:

As mentioned, the impact of the socio-economic status of the mother is nominal; the IQ of the mother is not. A low IQ has a major impact on the chance of a baby being born with a low birth weight; SES – not as much.
After being born, the child must face life. Specifically the prospect of being poor. Initially, the authors held all variable constant and displayed the prospects of a child remaining poor in the fist 3 years of life based on the mother’s SES. It didn’t look good. But what happens if we include IQ:

No change. The poverty rate of the child is equally determined by the SES and the IQ of the mother. With the data showing such an exact match as both SES and IQ moved from low to high, I suspect that there is a case where one is determined by the other.
Again, following the sections in this chapter, the topic switches to the Home Index:
The Home Observation for Measurement of the Environment (HOME) Inventory is designed to measure the quality and extent of stimulation available to a child in the home environment. The Infant/Toddler HOME Inventory (IT-HOME) comprises 45 items that provide information from the child’s perspective on stimuli found to affect children’s cognitive development. Assessors make observations during home visits when the child is awake and engaged in activities typical for that time of the day and conduct an interview with a parent or guardian. The IT-HOME is organized into six subscales: (1) Responsivity: the extent of responsiveness of the parent to the child; (2) Acceptance: parental acceptance of suboptimal behavior and avoidance of restriction and punishment; (3) Organization: including regularity and predictability of the environment; (4) Learning Materials: provision of appropriate play and learning materials; (5) Involvement: extent of parental involvement; and (6) Variety in daily stimulation. For the IT-HOME, 18 items are based on observation, 15 on interview, and 12 on either observation or interview.
This index was applied to the population in the study and the result showed that the socio-economic status of the mother played a role in the HOME Index rating. However, IQ played an even more significant role:
 As you can see, a lower IQ is more devastating than a poor mother while I high IQ is more beneficial than a wealthy mother.
As the child grows, the development of the child can be impacted by the conditions of the home, poverty and parenting skills are, of course, two of those conditions. In an attempt to measure this development, the authors conducted a survey of 4 developmental indicators and if a child scored in the bottom decile for any of the 4, they scored a “Yes” on the “development index.” If not, they scored a no.
The results:
 The pattern is again, presented. IQ at the low end is more detrimental than poverty while at the high end, IQ is more advantageous than being wealthy. However, in this specific study that difference is marginal.
The final section of the chapter looks into the IQ of the child and tries to determine the significance of been raised in a home more exposed to the challenges of poverty vs. being raised in a more affluent home. Additionally, the same investigation is conducted using the key variable of IQ:
 The result is consistent with data already being demonstrated in this and other chapters. The argument can be made that when isolating the socio-economic status of families and of mothers in the study the well being of the child generally suffers as that mother becomes poorer. However, when all variables are held constant save IQ, those other factors are diminished to the point of being statistically insignificant.
IQ matters.
Posted in Economics, Middle Class, Politics: National, The Bell Curve
Tagged Charles Murray, IQ, Parenting, Poverty, Richard Herrnstein, SES

To the Upper Class.
There is no lack of reports demonstrating that the middle class is shrinking. The unspoken conclusion? That we’re all getting poorer and that somehow, we’re all under attack.
In fact, there is a Pew Report on just that topic:
Since 2000, the middle class has shrunk in size, fallen backward in income and wealth, and shed some—but by no means all—of its characteristic faith in the future.
But from Pew’s own report we find this:

In 1971 25% of us were in the “Lower Income” bracket. Today there are 29% of us there. The middle class shrunk even as the number of “lower income” folks grew in numbers.
But look.
As those of us in the “lower income” grew by 4% points, the number of us in the “upper income” group grew as well. Grew by 6%.
We’re moving people from the middle to the top. We’re getting richer, not poorer.
 It takes a village.
A theme more or less explored in our politics in general. And sometimes in specific. For example, President Obama touched on it during his now famous firehouse stop in Virgina. There, on the stump, Obama extolled the crowd that successful folks are successful in large part, some part, to those that have come before. Their success is due, in some measure, to those who’ve built the infrastructure. Therefore, the logic goes, it is now up to those successful individuals to “give back” and embrace a higher tax burden.
The central idea being that we’re all part of this thing and we all need to contribute.
It takes a village.
Further, this is a concept I resonate with and embrace. We DO rely on each other. It’s the volunteer firefighter that makes sure our homes are safe. It’s the teacher that slaves away tirelessly at 10:00 at night. There’s the pastor watching over the kids during summer break. I love the fact that my son’s karate teacher watches him as he walks down the block to the dance studio to wait for his sister.
It DOES take that symbolic village.
Which makes this and this all the more frustrating:
A woman may be fined $600 for each day she provided free food to children in a poor Philadelphia neighborhood for the past few months.
Angela Prattis, 41, of Chester Township has been distributing free healthy lunches in a neighborhood that has a per capita income of $19,000 a year.
Prattis made no money from the meal distribution, and gave out food provided by the Archdiocese of Philadelphia. The “lunch lady” ran the charity out of her garage, to which about 60 children came, five days a week.
After the city council was alerted of the free lunches, it ruled that she would have to acquire a variance to give away food next summer – or pay a fine of $600 a day. The council considers Prattis’ deed a zoning violation. Three months of distributing food would instigate a fine of more than $50,000.
60 kids, 5 days a week. Free.
PHOENIX – The city of Phoenix is facing a possible lawsuit after a woman claimed a city worker told her she could not pass out free water in the Arizona heat without a permit.
Dana Crow-Smith tells ABC 15 she was passing out water bottles in the 112-degree heat along with others in an attempt to share their Christian beliefs with people attending a festival downtown last month, when a city worker ordered them to stop. She said the worker told the group they would be cited if they continued passing out the water because they did not have a permit.
Admittedly, the second case may not involve city officials in real authority, but the point remains that there is this idea that the city has these regulations.
It’s important to remember that the villagers created the village. Not the other way around.
Posted in Government, Idiots on Parade, Liberty
Tagged It Takes a Village, Philadelphia, Phoenix, Poor, Poverty

While I don’t think that I’m alone in my call that America’s educational system is in trouble I do find myself in the minority when it comes to ideas for possible reform. Included in my list of ideas are:
I’d imagine that for those that know me, this list isn’t shocking. It might be cringe worthy, but not out of line for how I think. For those that don’t know me, the list reads like the regular right-wing scree seen everywhere.
Whatever you think of the list, in favor or against, that list isn’t the point. The point is that the traditional view of America’s performance is being taken to task by Diane Ravitch in her recent CNN article:
It’s time to set the record straight. The only valid measure of academic performance in our schools is the federal test called the National Assessment of Educational Progress (NAEP). NAEP has been testing American students since the early 1970s.
This is something I didn’t know. I have always thought that tests like the SAT, ACTs and the Iowa Standard were legitimate tests. But whatever, I won’t quibble on the testing.
The NAEP test scores of American students are at their highest point in history: for black students, white students, Hispanic students, and Asian students.
They are at their highest point in history in fourth grade and in eighth grade, in reading and math.
To be sure, encouraging news. Further, news I must admit I didn’t know.
As for the international test scores, which Rhee loves to recite to knock our public schools, she is obviously unaware that our nation has never had high scores on those tests. When the first international test was given in 1964, our students ranked 11th out of 12 nations. Yet our nation went on to become the most powerful economy in the world.
In the 50 years since then, we have regularly scored in the bottom quartile on the international tests or at best, at the international average. Clearly, the international scores do not predict our future as we are the dominant economy in the world despite the scores.
I can’t resist to mention that things like economic freedom contribute to such things….
Why are our international rankings low? Our test scores are dragged down by poverty. As the poverty level in the school rises, the scores fall.
…
Rhee ignores the one statistic where the United States is number one. We have the highest child poverty rate of any advanced nation in the world. Nearly 25% of our children live in poverty.
THAT is the point of this post.
THAT is an argument that I resonate with. Of course, when comparing scores across nations, it’s important to normalize in some way across the variable that impact performance. And to Ms. Ravitch, poverty is just such a variable.
Watch:
On the latest international test, called PISA, our schools with low poverty had scores higher than those of Japan, Finland, and other high-scoring nations. American schools in which as many as 25% of the students are poor had scores equivalent to the top-scoring nations.
When normalized on poverty, the United States performs among the top in the world.
Should this be surprising? For me, it is. But then again I’ve bought into the narrative that we suck. So, taking our performance in new light…maybe it isn’t surprising.
One thing, however, I wonder if Diane Ravitch would be willing to slice the data in equivalent ways when it comes to healthcare?
Somehow I doubt it.
Posted in Education, Politics: International
Tagged Diane Ravitch, Health Care, Michelle Rhea, NAEP, Poverty

The second installment of the comparison of socioeconomic status and IQ. This post examines the impact of each on:
In a previous post, I showed various charts. Among them is the probability of cropping out of school based on the SES of the family:

The pattern is clear, kids from wealthier families have a better chance of obtaining a high school education.
The came the data showing the probability of a kid, who has dropped out, obtaining a GED:

This is a tale that is counter-intuitive. We expect the narrative to be that rich kids do better than poor kids. But this data shows the opposite for folks who obtain a GED after dropping out of school.
Finally we show data that speak to college degrees. College is, arguably, a key factor to the success of an individual in today’s society. Maybe.

The data suggests a massive SES impact. Very few kids from the poorest families are graduating college while nearly 40% of the wealthiest kids are achieving that milestone.
The data is somewhat mixed. High school and college graduation rates seem highly dependent on the SES of the parents while attainment of a GED is the exact opposite.
Now, what if we add in the predictive value of IQ?
First, dropping out of school:

The first thing that should be apparent is that dropping out of school is rare for kids of either average SES or intelligence. But dropout rates escalate dramatically for those of below average intelligence. IQ is more than a 3x predictor than SES of the school dropout.
How does GED look?

The data including IQ doesn’t change the fact that obtaining a GED goes against the commonly held belief that kids from poorer households do worse than the rich kids. Even accounting for IQ, the folks from the poorer families obtain a GED at higher rates than do kids from wealthier households.
Our last look into education is the college graduation rate:

Again, a dramatic difference. With one exception; the data shows very little difference between low SES and low IQ. But when it comes to highly intelligent kids, it doesn’t matter if they come from poorer families or wealthier families; the kids are graduating college at a better than 75% clip.
As with poverty, IQ plays a dominant role in the educational attainment of our children. All else being equal, the smarter the kid, the better they will achieve educationally.
Posted in Education, Middle Class, Politics: National, The Bell Curve
Tagged College, Drop out, GED, Poverty, SES, Socioeconomic, Socioeconomic Status

About 6 weeks ago I started posting data from the book, “The Bell Curve.” The first portion of the book deals with various conditions, poverty, education, crime and so on that take place in our society. And more than just look and detail those conditions, the authors try and look at what might cause some of those conditions. The point being that a vast majority of today’s commentators on such matters blame the socioeconomic conditions of families for the unfortunate plight many of our citizens find themselves in today.
Having problems graduating high school? Check and see if the kid is from a poor family.
Mothers raising children in poverty? Check and see of that mother herself came form a poor family.
Individuals in jail? Check and see if those folks came from a poor family.
And the evidence is there that such an impact exists. But is there another, stronger variable that impacts these conditions? The author’s answer is, “Yes. And that variable is IQ.”
Let’s review the first set of data I showed back then. The first set of data shows the probability that an individual will be living below the poverty line in 1989, the data the study used:

The next set of data shows the probability that a child will be living below the poverty line in 1989 when her mother is married:

And the third set of data shows that same probability for that same child if her mother is single.

The data has an uncomfortable, but not surprising trend, to be born wealthy is better than being born in poverty. However, here the authors, as I mentioned, looked for additional variables. Specifically IQ. Look at the data with the socioeconomic status AND the IQ included in the same graph.
Let’s go down the line starting with the probability of living in poverty:

The difference is dramatic. Not only does having a very low IQ put you at significant risk of living in poverty compared to having a very low SES background, but being very intelligent is more important than being very wealthy.
Next we look at children of married mothers living in poverty and the impact that her SES and IQ have:

While the dramatic difference in the values isn’t the same, the pattern is. A mother having everything else considered who is less intelligent has a higher probability of raising her children in poverty than an equally neutral mother of higher intelligence.
Finally, the probability of children of single mothers living in poverty and the impact that her SES and IQ have:

Right back to the dramatic difference. What looked like an impacting variable before, SES clearly now has the appearance of having a minimal effect on raising children in poverty. Rather IQ dominates this condition for children of single mothers. Those children lucky enough to be born to the brightest of mothers have a 1/7th the chance of living in poverty compared to those children whose mothers score on the very lowest on IQ tests.
Clearly, as it relates to poverty and child poverty, IQ is the runaway variable when compared to SES.