Tag Archives: Poverty

Cost Of Raising A Child

For some reason as I was driving home yesterday, a thought occurred to me:

If one group of people paid $5.00 for a beer and another group of people paid $2.00 for a beer, would one group of people drink more beer than the other?

Or

If one group of people paid ~$200,000 to have a child and another group of people paid ~$0.00 to have a child, which group of people would have more children?

So, here I am looking at the data:

A middle-income family may spend $234,900 to raise a child born in 2011 to the age of 18, a 3.5 percent increase in a year, according to a government report.

That is a lot of money.  But the costs are not fixed:

The typical two-parent middle-income family spent $12,290 to $14,320 in 2011 on each child, the study found. Households that make less spend less, USDA researchers said. A family earning less than $59,410 a year will probably spend $169,080 in 2011 dollars to rear a child, while parents earning more than $102,870 may pay $389,670, according to the study.

And it can get worse than that.  According to this calculator the cost of raising a child can be as high as $434,180 if you earn more than $100k.

Earn less than $57,800 and you pay $133,710.  That’s $7,300 this year alone.

With government assistance to those poorest among us, that $7,300 can be completely covered reducing the real cost to near zero.

So, given the differences in the cost of raising children, I came to the conclusion that wealthy individuals have fewer children than do those less wealthy.

Was I right?  According to the Census I was:

The births per 1,000 women below 100% of the poverty line in 2008 was 96.3.  Births per 1,000 women above 200% of the poverty line that same year was almost exactly half : 47.7.

If income levels are pulled out, there is a steady climb in births per 1,000 from the wealthiest to the least wealthy.  A notable exception are the very poorest mothers:

Income Births Per 1,000
Less than $10,000. 33.7
$10,000 to $14,999. 103.8
$15,000 to $24,999. 86
$25,000 to $34,999. 80.3
$35,000 to $49,999. 72.3
$50,000 to $74,999. 64.4
$75,000 to $99,999. 57.4
$100,000 to $149,999. 51.8
$150,000 to $199,999. 49.3
$200,000 and over. 49.8

Certainly much more than the cost of raising a child goes into the decision of whether or not to have a baby.  Perhaps something as simple as the cost of contraception goes into the amount of pregnancies among the wealthy and the poor.  But it would be foolish to wave away the fact that the cost of raising a child is much higher for those who have more money and thus acts as a drag on the birthrate among that population.

Parenting: SES Impact – The Bell Curve

I’m continuing my series on the chapters of “The Bell Curve”, by Herrnstein and Murray.  If you are interested in the posts so far, just go to the category selections on the right sidebar, I’ve grouped them together under The Bell Curve.

The other day we dealt with welfare and the impact that socioeconomic status has on:

  1. Going on it
  2. Staying on it

The results were mixed.  The answer, it depends.

Today we’re gonna look at parenting and the impact of the SES of the mother on her children.

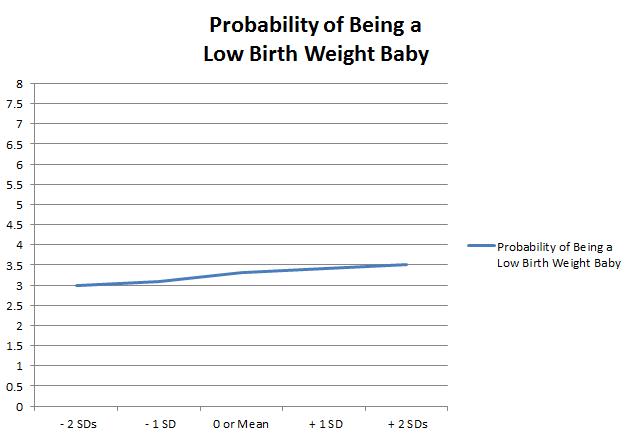
Even before the life of the child has a chance to take off, a critical component of parenting is the birth weight of that child.    By examining the socioeconomic status of the mother we might catch a glimpse of it’s impact on her children:

As you can see from the chart the impact of the socioeconomic status of the mother is small or meaningless.

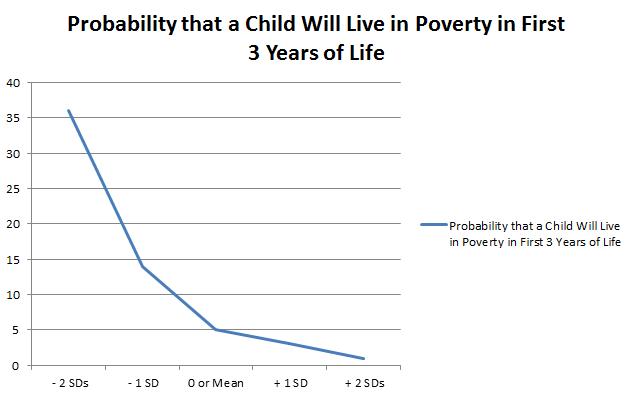
Moving to the early life of the child, the authors explore childhood poverty in the first three years of the child’s life.  Again, holding other variables constant, the impact of the SES of the mother:

That impact is dramatic.  Poor women raises poor kids while the wealthy mothers raise children above the poverty line.  As soon as the mother’s wealth dropped below the average, the probability of childhood poverty rises very steeply.

The next set of data describes the impact of the SES of the mother on the HOME index.

 The Home Observation for Measurement of the Environment (HOME) Inventory is designed to measure the quality and extent of stimulation available to a child in the home environment. The Infant/Toddler HOME Inventory (IT-HOME) comprises 45 items that provide information from the child’s perspective on stimuli found to affect children’s cognitive development. Assessors make observations during home visits when the child is awake and engaged in activities typical for that time of the day and conduct an interview with a parent or guardian. The IT-HOME is organized into six subscales: (1) Responsivity: the extent of responsiveness of the parent to the child; (2) Acceptance: parental acceptance of suboptimal behavior and avoidance of restriction and punishment; (3) Organization: including regularity and predictability of the environment; (4) Learning Materials: provision of appropriate play and learning materials; (5) Involvement: extent of parental involvement; and (6) Variety in daily stimulation. For the IT-HOME, 18 items are based on observation, 15 on interview, and 12 on either observation or interview.

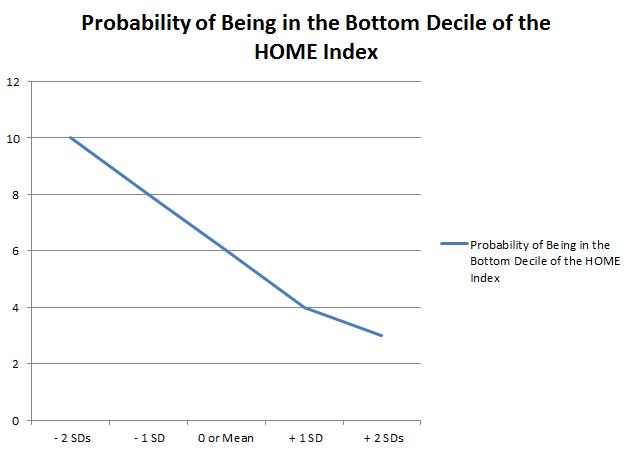
In 1986, 1988 and 1990, the NLSY conducted surveys of the children and mothers using the HOME observations.  From that data, the authors build a probability of scoring in the lowest decile of that index based on the SES of the mother:

Again we see the pattern.  As the wealth of the mother decline, the HOME index score of the family unit becomes worse.  Only 3 in 100 of the wealthiest women have children in the lowest decile in the index while the poorest women have 10 in 100.

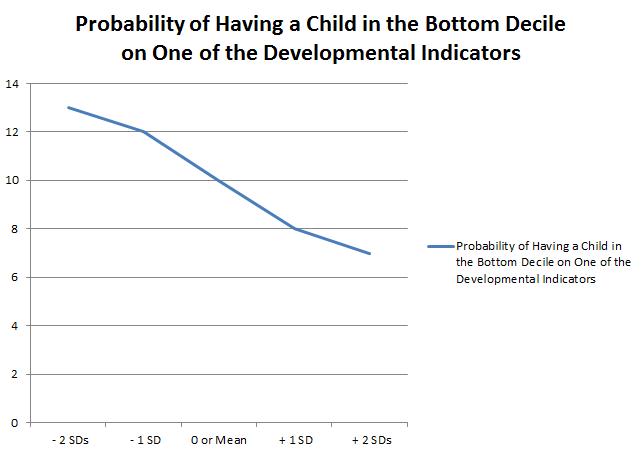
The next topic in the chapter deals with developmental outcomes of the children of moms in the NLSY.  The study administered a host of tests regrading those outcomes.  In short, the book is looking at measuring those children who scored in the bottom decile of the 4 indicators of a given test year.  If they answered “yes” for any of the four tests being in that bottom decile or “no” if they did not.

The results holding all variables equal but SES of the mother:

The data is relatively modest; 5 points separate the top from the bottom.

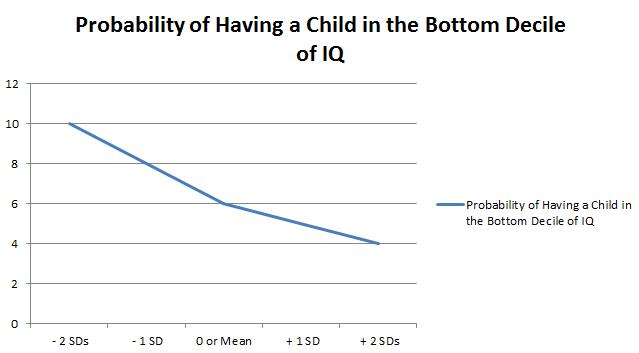
Finally, the last factor studied in the chapter – the IQ of the child.  Here the authors again decided to look at the probability of the child ranking in the bottom DECILE of IQ based on the SES of the mother.  Again, the data:

Again, the impact of the mother’s SES status is mild; moving the ranking from 10% to 4%, highest to lowest.

In conclusion, with the notable exception of living in poverty for the first 3 years of life, the SES of the child’s mother has only mild predictive value in the studied outcomes.

Equality: Perfectly Providing Equal Opportunity

What if we could, with perfection, create a nation that provided equal opportunity?

Whatever that may mean to you, suppose it’s true.  Every kid has the same chance to get to a good school and graduate from it.  College?  Available to all.  While not important to this conversation, we could say that college could be free.  There would be no need to worry about poor families being unable to send their bright children to the hallowed halls of higher eduction.

Poverty create hurdles due to inability to buy books, electricity or heat?  Gone.  We’ll adjust for it.

Any problem you might have that produces unequal opportunities has been answered.  To your individual liking.

Everyone has the same chance.

Question:

What characteristic or quality would determine who succeeds?

Poverty: Socioeconomic Impacts – The Bell Curve

I’m reading “The Bell Curve” and am finding the book fascinating.  As I mentioned in my previous post on this topic:

That attaining wealth is more and more becoming reserved for the pre-existing well to do’s.

For a long time I’ve fought this belief.  I’ve fought the idea that America is not the land of opportunity.  That we’ve somehow lost the idea that if you work hard enough you can do anything.

I’ve fought it.

And now I’m reading a book, The Bell Curve, and I’ve seen some interesting data.  For example, it seems to be important where you come from if you wanna avoid poverty:

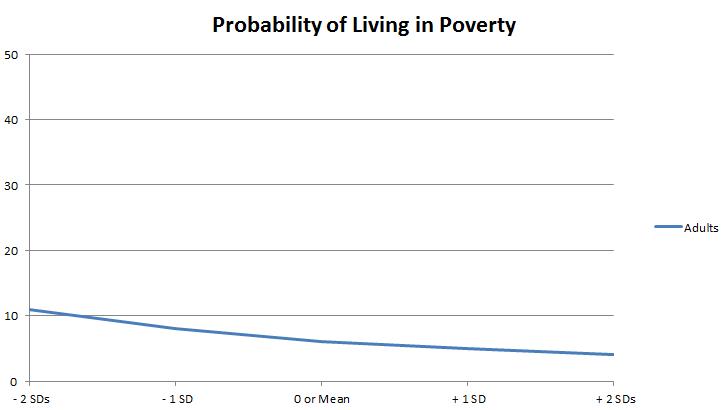
As I continue to make my way through the book, there is good data that reinforces the above statement.  Namely, where you come from, or who you are born to, impacts where you will end up.  Consider the white population:

I can only estimate the data above, the book doesn’t provide exact numbers, but you can see that as parental SES goes from 2 standard deviations below the mean to 2 standard deviations above the mean, the chance that an individual finds themselves in poverty is reduced.  In fact, if you look at the numbers, the families at the far poor end of the scale have almost three times the chance to produce poor children than the very well off families at the other end.

What if we dig deeper in the data?  What happens if we look at the probability that a child lives in poverty?  How does socioeconomic status impact that?

Well, it turns out that the data is divided.  For example, consider married white mothers:

Interesting.

It turns out that that being a married mother helps reduce the chance of childhood poverty.  Reduces but only slightly.  However, what is interesting is that the impact of a higher socioeconomic parent is magnified.  In the general public, a higher parental SES ranking meant that an adult had 1/3 the chance of ending up in poverty.  For children, it’s much more dramatic.

For a child, having parents in the lowest SES class means that poverty is ~5.5 times as likely than if that child came from parents in the highest SES rankings.  That is, kids from the most well of parents suffer poverty at rates of about 2%.  Kids from the least well off suffer poverty at rates of about 11%.

Now for the shocker.  Let’s look at single white mothers:

WOW!

Kids of white mothers that are either separated, divorced o r never married suffer massively higher rates of poverty than mothers of kids who are married.  But again, for the sake of this specific conversation, the socioeconomic ranking of the parents is meaningful.  Parents who rank at the very low end raise kids who have approximately a 39% chance of being in poverty.  Mothers who are in the top ranks of socioeconomic ranking?  Their kids only have about a 30% chance of living in poverty, almost a 33% less chance.

The data is hard to argue with.  The “well off-ness” of the parents seems to have a powerful impact on the chance of poverty of a child.


Poverty And Class In America

There’s been a lot of discussion surrounding the mobility between classes here in America.  At the same time, there’s been a lot of discussion surrounding the importance of education.  Not only getting a high school diploma but on getting a college one as well.  In fact, it’s gone so far as to have people calling for free college education for all Americans.  The argument is that the rich get richer while the poor get poorer.  That income mobility in America is restricted.  That attaining wealth is more and more becoming reserved for the pre-existing well to do’s.

For a long time I’ve fought this belief.  I’ve fought the idea that America is not the land of opportunity.  That we’ve somehow lost the idea that if you work hard enough you can do anything.

I’ve fought it.

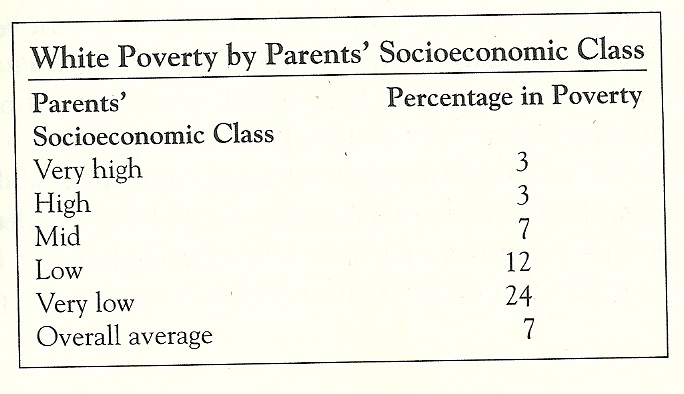
And now I’m reading a book, The Bell Curve, and I’ve seen some interesting data.  For example, it seems to be important where you come from if you wanna avoid poverty:

If you’re born to a family with very low socioeconomic class, you have an 8 times better chance to find yourself in poverty than if you were born to a family with a very high socioeconomic status.

It would seem that class matters.

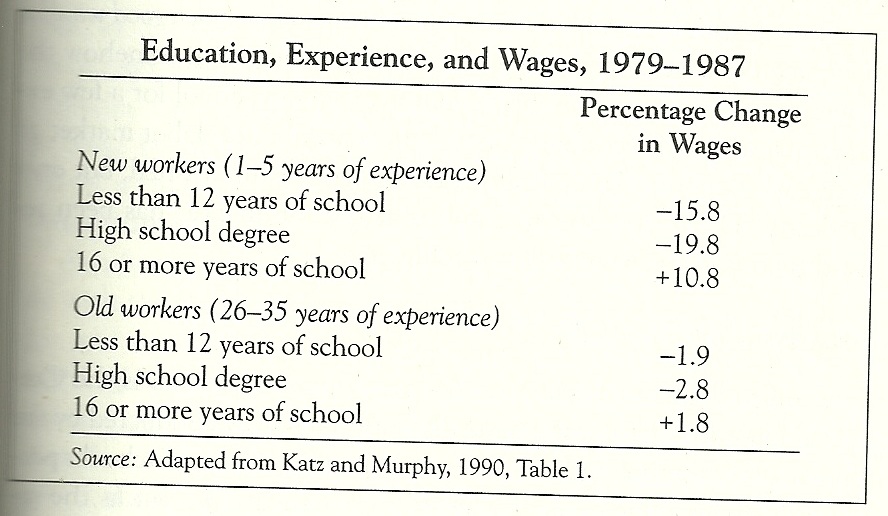
Further, when it comes to wages, the data suggests that there is an education gap that would strengthen the argument that we need to increase college degrees to our kids:

It’s hard to argue the numbers.  High school droop-outs are seeing their wages drop by double digits while college graduates are seeing double digit increases.

Interesting data to be sure.


People Who Are Bad At Money Don’t Have Money

Poverty in the United States is a problem.  When folks are poor they are less healthy, receive less education and are more likely to raise children who are poor themselves.  And there are a lot of noble efforts to curb poverty in the US.  Much of that effort is, of course, centered on taking money from people who have it and giving it to other people who don’t.

There are schools of thought that say, “The wealthy are able to give their children unfair advantages.  We need to remedy this unfairness by proxy; giving money to the children of the poor.”

Not surprisingly, I don’t agree with this.

Continue reading

Poverty: Reducing The Number Of The World’s Poor

It’s not easy bein’ an American worker these days.  There’s a lot of pressure coming from around the world; folks wantin’ our jobs, willing to work for less money than we’re workin’ for.

It’s hard being an America sometimes.

But there’s an upside.  For the folks who care about such things, the world’s poorest people, people living a life exactly like their parents, grandparents and ancestors have lived for generations, are finally emerging from poverty.  Perhaps for the first time ever, families are leaving the shackles of poverty and rising towards the hope of a middle class, perhaps dare I say, even more.

Continue reading

Wherein The Economist Channels Pino

If I’ve said it once I’ve said it a thousand times, if you wanna sell more beer, lower the price.  The same concept exists for labor.  If you want people to buy more labor, lower the price of labor.

But even as we face unprecedented levels of unemployment, there are people in the world that wanna make it harder for people to hire people.  They suggest that the real value of the current minimum wage is low and that we should consider raising it match past level.

I don’t understand how pricing low margin workers out of the job market right now makes sense.  And the Economist agrees with me.

Continue reading

Mitt Romney: I Don’t Care About Poor People

Recently Mitt Romney made a statement that many, on both sides, are using to against him.  From the Blue, Romney is being attacked on that comment by having it taken out of context.  The left is going to say that Romney said:

Former Massachusetts Gov. Mitt Romney said on Wednesday that he’s “not concerned about the very poor,”

When in fact he said:

“I’m in this race because I care about Americans. I’m not concerned about the very poor. We have a safety net there. If it needs repair, I’ll fix it,” the Republican front-runner said Wednesday on CNN, following his victory in the Florida primary.

Be that as it may, it’s election politics and the tactic is used by both the Red and the Blue.

But is the statement true?

Continue reading

The Impact Of Marriage: Poverty And Children

I have been making the point that one of the contributors to poverty, income disparity and perhaps income mobility is marriage.  I’ve been making the case that marriage tends to bring people out of poverty and failing to get married tends to make one more likely to experience poverty.

For example, I’ve demonstrated that the GINI, or disparity in income, falls as the marriage rate increases in a population:

  • 50% Marriage:  .3446
  • 60% Marriage:  .3353
  • 70% Marriage:  .3227
  • 80% Marriage:  .3015

As the marriage rate went up, the GINI went down.  In other words, as my population increased its marriage rate the inequality diminished.  In fact, by moving from a 50% marriage rate to an 80% rate, the GINI moved by 12%.

Let’s do it again.  10,000 new salaries, same constraints:

  • 50% Marriage:  .3471
  • 60% Marriage:  .3416
  • 70% Marriage:  .3248
  • 80% Marriage:  .3093

Again, a continuing trend toward equality.

As the population marries, the GINI falls.  And this is just a mathematical observation, it has nothing to do with the social benefits that occur due to marriage.

Further, data from the Urban Institute and American University shows that marriage impacts poverty in more concrete ways:

The gains from marriage extend to material hardship as well. About 30 percent of cohabiting couples and 33-35 percent of single parents stated that sometime in the past year they did not meet their essential expenses. These levels are twice the 15 percent rate experienced by married parents. Even among households with similar incomes, demographic and educational characteristics, married couples suffer fewer serious material 21 hardships. Moreover, despite their less promising marriage market, low-income and less educated mothers who are married experience significantly less material hardship than low income,
less-educated mothers not married.

Marriage retained an advantage in limiting hardship even among families with the same incomes relative to needs. The variables used for controlling for the effect of income to-needs ratios were the income-to-needs ratios in the current wave of SIPP (the prior four month period) as well as the mean level and the stability of income-to-needs ratios during the 28 months prior to the current wave. Not surprisingly, higher current welfare ratios, higher past welfare ratios, and lower instability of welfare ratios were all associated with less hardship. However, the inclusion of the income variables left intact virtually all of the differences by marital and family status.

Families that fit in the same income that are married fare better than families that are not married.

The other day I posted on poverty and how to avoid it.  One of the key barriers to middle class is not getting married:


The Immediate Prerequisites to Success Are:

  1. Receive a good education [graduate high school]
  2. Work full time
  3. Marry [And do it before having kids]

But do we have data?  Have we been able to demonstrate that marriage is a determining factor?

Yes.  There is data that backs up the idea that marriage, and just marriage, would reduce our poverty rate significantly:

Economists Isabel Sawhill of Brookings and Adam Thomas of Harvard have conducted a fascinating analysis of whether higher marriage rates would reduce poverty in the United States.4 Employing statistical modeling, they analyzed data from the Census Bureau to determine how poverty would be affected if poor people behaved differently. In particular, they modeled the effect on poverty rates of more work, more marriage, more education, and fewer children by poor adults. In the case of marriage, they simply matched unmarried people by age, education, and race until the marriage rate for the nation equaled the marriage rate in 1970. This exercise showed that if we could turn back the clock and achieve the marriage rate that prevailed in 1970, poverty would be reduced by well over 25 percent.

Impressive indeed.  Simply returning to 1970 rates of marriage, we would be able to realize a significant improvement in our poverty numbers.  And to put this in perspective, social welfare programs aren’t even close when it comes to effectiveness:

By way of comparison, doubling cash welfare would reduce poverty by less than one-third as much as increasing marriage rates.

We could double spending and reduce  poverty.  But it would only be one-third as effective as getting people to get married.

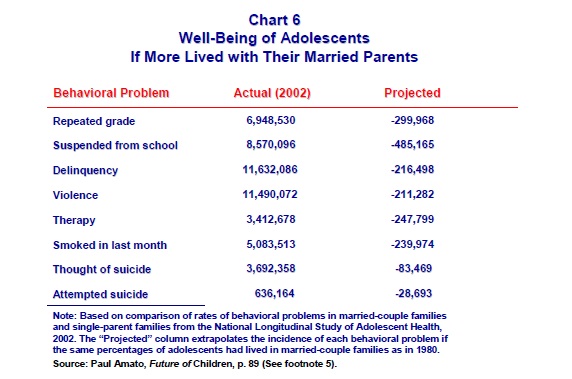
And as a way of comparison, look at the impact of poverty on kids and what reducing that impact by getting married would do:

Marriage, and the declining marriage rate, is a key to poverty in the United States.