Category Archives: Middle Class

What Makes The Middle Class

Middle Class

The Middle Class.

What is it?  Who is it?  How do you get there, stay there or even leave there?

What does it mean to be Middle Class?

Some might define it literally:

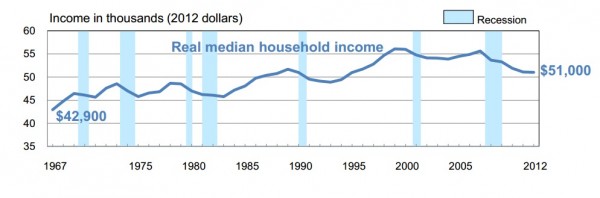
One helpful yardstick to judge whether you’re middle class: Median household income was $51,017 in 2012, according to the most recent U.S. census data. Robert Reich, a professor of Public Policy at the University of California-Berkeley and former Secretary of Labor, has suggested the middle class be defined as households making 50 percent higher and lower than the median, which would mean the average middle class annual income is $25,500 to $76,500.

If you’re in the middle of the middle, however – not lower or upper-middle class – that would be an income range between $39,764 and $64,582, says Aaron Pacitti, an assistant professor of economics at Siena College in Loudonville, N.Y.

Another such literal definition:

Financial Samurai Definition Of Middle Class: If you make within +/- 50% of your city’s household income for your age, you are middle class. For example, the average household income in San Francisco is $80,000. A person making $40,000 – $120,000 can comfortably consider himself or herself middle class. The cost of living in Des Moines, Iowa is obviously much lower, and the incomes will adjust accordingly. Income is only one part of wealth.

And finally a more descriptive definition:

The Middle Classes
Next come the middle classes, which make up the vast majority of the American population, and at the top of the middle class is the upper middle class, also known as the top of the class. Members of this class tend to be well educated, hold post-secondary degrees and have high-paying, white-collar positions. This class is male-dominated, and has an income of $100,000 or more annually. That’s enough to stay at the top one-third of U.S. incomes.

In the middle of the middle classes is the lower middle class. This class usually has households with people who have a college education, but these people don’t have the degrees necessary to advance into higher-earning positions. This class contains lower-level, white-collar workers who generally earn between $32,500 and $60,000.

The lower middle class can be split into two different categories: the satisfied middle and the struggling middle. The satisfied middle can still find satisfaction and positivity in their lives, despite their modest incomes, and include a disproportionate amount of young and old, but no middle-aged adults. The struggling middle, however, contains households that actually earn “a lower median family income than Americans who put themselves on the lowest rungs of the social ladder,” and have a disproportionate amount of women and minorities, enabling them to have a lot in common with the lower class.

At the bottom of the middle classes is the working class, also known as the blue-collar class or as the anxious middle. This class is the most dissatisfied and downbeat of the middle classes, and don’t have as much education, meaning that they may have gone to college, but have more technical or vocational training. They are also usually paid by the hour, and have a variety of jobs, including: police officer, truck driver and factory worker. Salaries in this class fall between lower middle class and the poverty level, with a range of $23,050 to $32,500.

I suspect that 2015 and 2016 will bring about a large debate concerning the middle class.  Elizabeth Warren is going to talk a WHOLE lot about the destruction of the middle class with very little work on defining it.

I’m interested.  What IS the middle class?

Household Income

I just finished a post that explained, in part, the rise of income levels of the 1%:

…the primary source of income of the wealthy is the market and not salary.

It’s important to point this out as our current administration continues to rail against income disparity all the while pushing for policies that help contribute to the “problem” all the while.

But check out a recent post from AEI:

During his economic speech yesterday, President Obama again suggested that the typical US middle-class family has seen no economic progress over the past 30 years:

Because even though our businesses are creating new jobs and have broken record profits, the top 1 percent of Americans took home 20 percent of the nation’s income last year, while the average worker isn’t seeing a raise at all. In fact, that understates the problem. Most of the gains have gone to the top one-tenth of 1 percent. So in many ways, the trends that have taken hold over the past few decades of a winner-take-all economy, where a few do better and better and better, while everybody else just treads water or loses ground, those trends have been made worse by the recession.

Now I have debunked this claim several times. And now so has the US Census Bureau. The above chart, from the agency’s new income and poverty report, clearly shows real median household income indeed rose over the Long Boom of 1983 through 2007. And remember, the Census Bureau is just tracking pre-tax, pre-transfer, non-fringe benefit market income. As agency itself concedes: “The money income measure does not completely capture the economic well-being of individuals and families.”

091713census1-600x198Leading up to the recession, real median income was rising.  It’s only been since Obama’s time in the White House that such incomes are dropping.

The Value Of Employment’s First Rung

Minimum WageMuch has been discussed with jobs, minimum wage, poverty, the income gap and unemployment.  One of my central themes is that wages are not the full story when it comes to compensation.  Another is that minimum wage jobs are NOT meant to be careers and certainly are not meant to be a means by which we raise a family.

Rather, these jobs are meant to be the first rung in the employment ladder.  In addition to modest wages they teach job skills; customer service, scheduling, listening, task completion and plain old “boss respect”.

An old story that emphasizes this point:

Here’s one reason why Volkswagen likes hiring former fast-food employees for its 2.5 million-square-foot plant here in the heart of the Tennessee Valley.

“Inexperience is a key,” said Gary Booth, director of the Volkswagen Academy training operation. “Some of our best employees came from McDonald’s. They know standardized work.”

Booth, strolling the halls of Volkswagen’s 163,000-square-foot training facility connected to the plant, said he doesn’t want to hire assembly-line workers who have developed “bad habits” at previous manufacturing jobs.

I work at a highly specialized center and I continually advocate hiring local McDonald managers to fill our centers.

Just sayin’.

If I Had A Dream

MLK

If I had a dream, it would be that all people, regardless of color or nationality, would have the same shot at success that I have.  And in the glow of the 50th Anniversary of Martin’s speech, I am depressed that we aren’t there yet.

And infuriated that the policies of the Left, who claim to have the best interests of black America as their goal, has made it so much harder than it has to be:

The history of black workers in the United States illustrates the point.  As already noted, from the late nineteenth-century on through the the middle of the twentieth-century, the labor force participation rate of American blacks was slightly higher than that of American whites.  On other words, blacks were just as employable at the wages they received as whites were at their very different wages.  The minimum wage law changed that.  Before federal minimum wage laws were instituted in the 1930’s, the black unemployment rate was slightly lower than the white unemployment rate in 1930.  But then followed the Davis-Bacon Act of 1931the National Industrial Recovery Act of 1933 and the Fair Labor Standards Act of 1938 – all of which imposed government-mandated minimum wages, either on a particular sector or more broadly.

The National Labor Relations Act of 1935, which promoted unionization, also tended to to price b lack workers out of jobs, in addition to union rules that kept blacks from jobs by barring them from union membership.  The National Industrial Recovery Act raised wages in the Southern textile industry by 70% iin just five months and its impact nationwide was estimated to have cost blacks half a million jobs.  While this Act was later declared unconstitutional by the Supreme Court, the Fair Labor Standards Act of 1938 was upheld by the High Court and became the major force in establishing a national minimum wage.  As already noted, the inflation of the 1940’s largely nullified the effect of the Fair Labor Standards Act, until it was amended in 1950 to raise minimum wages to a level that would have some actual effect on current wages.  By 1954, black unemployment rates were double those of whites and have continued to be at that level or higher.  Those particularly hard hit by the resulting unemployment have been black teenage males.

Even through 1949 – the year before a series of minimum wage escalations began – was a recession year, black teenage male unemployment that year was lower than it was to be during the later boom years of the 1960’s.  The wide gap of unemployment rate of black and white teenagers dates from the escalation of the minimum wage and the spread of its coverage in the 1950’s.  The usual explanations of high unemployment of black teenagers -inexperience, less education, lack of skills, racism – cannot explain their rising unemployment, since all these things were worse during the earlier period when black teenage unemployment was much lower.  Taking the more normal year of 1948 as a basis for comparison, black male teenage unemployment then was less than half of what it would be during the decade of the 1960’s and less than one-third of what it would be in the 1970’s.

Unemployment among 16 and 17-year-old black males was no higher than among white males of the same age in 1948.  It was only after a series of minimum wage escalations began that black male teenage unemployment not only skyrocketed but became more than double the unemployment rates among white male teenagers.  In the early twenty-first century, the unemployment rate for black teenagers exceeded 30 percent.  After the American economy turned around in the wake of the housing and financial crisis, unemployment among black teenagers reached 40 percent.

The juxtaposition of the stories this week, Martin’s speech and the fast food worker’s strike, is a simple lesson of a sublime dream turned into nightmare by the policies of a party gone horrible wrong.

From Poverty To Middle Class

Middle Class

A conversation on my Facebook feed brought me here today:

In addition to the thousands of local and national programs that aim to help young people avoid these life-altering problems, we should figure out more ways to convince young people that their decisions will greatly influence whether they avoid poverty and enter the middle class. Let politicians, schoolteachers and administrators, community leaders, ministers and parents drill into children the message that in a free society, they enter adulthood with three major responsibilities: at least finish high school, get a full-time job and wait until age 21 to get married and have children.

Our research shows that of American adults who followed these three simple rules, only about 2 percent are in poverty and nearly 75 percent have joined the middle class (defined as earning around $55,000 or more per year).

Three things.  Simple things.  Not hard to do things.

Go to school and finish it.

Get a job.  Any job.

Wait to have children.

Income Inequality Crisis in 16 Charts – Response Part I

16 Charts.2

There has been a constant dull roar regarding the meme of income inequality.  I often see it in blogs and news articles in left leaning publications.  Lately though, I’ve seen it hit my social media pages.  Last night I found the whole thing summed up in one article:

Now we are engaged in a great tug-of-war over a few points in the top tax rate in Washington. But even if the White House pulls hardest, it won’t amount to much of a victory for the long-suffering middle class. The sources of their income stagnation are too deep, too varied, and too long-term for Clinton-era tax rates to cure them.

“There is a huge amount of focus on progressive taxes in our policy world but progressive taxes are not much of a solution to this,” said Lawrence Mishel, president of the left-leaning Economic Policy Institute. “We need to get unemployment down rapidly. We need to greatly change our labor standards. We need to raise the minimum wage.”

He’s right: The middle class crisis — and its resulting income inequality — is the most important economic story of our time. There are a million ways to tell it, and here’s another: an annotated slide show, culled from the amazing 2012 edition of the State of Working America from EPI.

Thompson goes into an argument for the next 16-17 slides and discusses the usual suspects; wage gap, wealth distribution, distribution of stock market wealth and minimum wage.  There are some other pieces of data there to, but all the big ones were represented.

As I scrolled through, I just by chance grabbed the 2nd chart to investigate.  Thompson says:

Adding to the mystery is the remarkable de-coupling of productivity from real hourly compensation for all workers, including college graduates. The break seems to have occurred in the 1970s and accelerated very recently. Productivity grew steadily in the 2000s. Compensation didn’t.

I checked into what might have happened that would cause this de-coupling.  This is what I found:

The level of productivity doubled in the U.S. nonfarm business sector between 1970 and 2006. Wages, or more accurately total compensation per hour, increased at approximately the same annual rate during that period if nominal compensation is adjusted for inflation in the same way as the nominal output measure that is used to calculate productivity.

More specifically, the doubling of productivity since 1970 represented a 1.9 percent annual rate of increase. Real compensation per hour rose at 1.7 percent per year when nominal compensation is deflated using the same nonfarm business sector output price index.

In the more recent period between 2000 and 2007, productivity rose much more rapidly (2.9 percent a year) and compensation per hour rose nearly as fast (2.5 percent a year).

The relation between productivity and wages has been a source of substantial controversy, not only because of its inherent importance but also because of the conceptual measurement issues that arise in making the comparison.

Two principal measurement mistakes have led some analysts to conclude that the rise in labor income has not kept up with the growth in productivity. The first of these is a focus on wages rather than total compensation. Because of the rise in fringe benefits and other noncash payments, wages have not risen as rapidly as total compensation. It is important therefore to compare the productivity rise with the increase of total compensation rather than with the increase of the narrower measure of just wages and salaries.

The second measurement problem is the way in which nominal output and nominal compensation are converted to real values before making the comparison.   Although any consistent deflation of the two series of nominal values will show similar movements of productivity and compensation, it is misleading in this context to use two different deflators, one for measuring productivity and the other for measuring real compensation.

In short, compensation has, in fact, kept pace with productivity not lagged.  In fact:

Total employee compensation as a share of national income was 66 percent of national income in 1970 and 64 percent in 2006. This measure of the labor compensation share has been remarkably stable since the 1970s. It rose from an average of 62 percent in the decade of the 1960s to 66 percent in the decades of the 1970s and 1980s and then declined to 65 percent in the decade of the 1990s where it has again been from 2000 until the most recent quarter.

Again, when viewed as compensation and not the more simplistic wage, we are, to quote, remarkably stable” since the 1970’s.

But what happened in 1970’s that might change the way compensation was distributed?  Legislation:

During the 1970s, there were some important legislative and legal changes affecting compensation and workplace issues. Among the most important were the Employee Retirement Income Security Act of 1974 (ERISA) and the Revenue Act of 1978. ERISA regulated private pensions and imposed financial and accounting controls. ERISA also established the Pension Benefit Guaranty Corporation to ensure that workers would be paid their vested pension benefits, if their pension plans were terminated. The Revenue Act encouraged flexible benefit plans, and created the 401(k) defined contribution retirement savings plan. It also allowed employees to make elective pre-tax contributions to a variety of savings vehicles, such as saving, profit sharing, and employee stock ownership plans. In retrospect, these laws were extremely important, as they contributed to the change in the share of compensation accounted for by pensions and other retirement benefits.

Other important legislation that affected active and retired workers without necessarily affecting compensation directly included the Occupational Safety and Health Act of 1970, which authorized the Secretary of Labor to establish occupational safety and health standards in the workplace; the Comprehensive Employment Training Act of 1973, which consolidated and decentralized Federal employment programs and provided funds to State and local governments who sponsored employment services; and the 1974 amendment to the Social Security Act, which provides automatic cost-of-living adjustments, based on the Bureau’s Consumer Price Index.

The below chart shows what has happened over the twenty year period from 1966 to 1986:

16 Charts.2a

Just in those 20 years, cash money took a nearly 10% hit in the ratio of compensation.  Keeping that compensation constant, there should be little surprise that wages have fallen in proportion to productivity.

It turns out that Thompson’s analysis of the data depicted in that chart is incorrect, or misleading.  Employees are being compensated nearly the same since at least 1970.


Are The Poor Getting Poorer While The Rich Get Richer?

Poor

I suspect the charge has been leveled for as long as anyone can remember:

The rich are getting richer at the expense of the poor who are only getting poorer.

But is it true?

As with all things, it depends on how you measure it.

The White House Favors Moving Cell Phones Out Of Reach For Poor Americans

Cell Phone

Obama’s White House has an online petition process whereby any petition submitted that obtains 25,000 signatures or more will be guaranteed a response by the White House.  Recently, just such a petition hit more than 100,000 signatures:

The Librarian of Congress decided in October 2012 that unlocking of cell phones would be removed from the exceptions to the DMCA.

As of January 26, consumers will no longer be able unlock their phones for use on a different network without carrier permission, even after their contract has expired.

Consumers will be forced to pay exorbitant roaming fees to make calls while traveling abroad. It reduces consumer choice, and decreases the resale value of devices that consumers have paid for in full.

The Librarian noted that carriers are offering more unlocked phones at present, but the great majority of phones sold are still locked.

We ask that the White House ask the Librarian of Congress to rescind this decision, and failing that, champion a bill that makes unlocking permanently legal.

The petition, on its face, is fine.  However, one thing that it left out was the impact of just such a ruling would mean.

Today, cell phone operators subsidize cell phone purchases in exchange for a contract that locks the customer in for a predetermined amount of time.  This subsidy, often in the hundreds of dollars, allows for customers to obtain these phones very cheap or, in some cases, free.  By allowing people to unlock their phone legally, the cell phone companies will have no incentive to subsidize their phones and will, as a result, force the customer to assume the full cost of the phone.

The result?  Normal folks are going to be faced with higher cell phone costs than they otherwise would be.

Stagnant Middle Class

Perhaps this is simply a myth.

Don Boudreaux and Mark Perry weigh in over at the Wall Street Journal:

A favorite “progressive” trope is that America’s middle class has stagnated economically since the 1970s. One version of this claim, made by Robert Reich, President Clinton’s labor secretary, is typical: “After three decades of flat wages during which almost all the gains of growth have gone to the very top,” he wrote in 2010, “the middle class no longer has the buying power to keep the economy going.”

This trope is spectacularly wrong.

Don and Mark touch on a point that I often make:

…this wage figure ignores the rise over the past few decades in the portion of worker pay taken as (nontaxable) fringe benefits. This is no small matter—health benefits, pensions, paid leave and the rest now amount to an average of almost 31% of total compensation for all civilian workers according to the BLS.

That’s not an insignificant amount.  I often hear that compensation for health care shouldn’t count, after all, why should the worker have to accept ever increasing costs of fixing a broken leg?  A response to which I ask, “Would you be willing to give up that health insurance?”

Always the answer is no.

However, they point out a concept that I often miss:

One underappreciated result of the dramatic fall in the cost (and rise in the quality) of modern “basics” is that, while income inequality might be rising when measured in dollars, it is falling when reckoned in what’s most important—our ability to consume.

I absolutely think it’s critical to include in these conversations what we are able to consume today as opposed to 30 years ago.

Finally:

Despite assertions by progressives who complain about stagnant wages, inequality and the (always) disappearing middle class, middle-class Americans have more buying power than ever before. They live longer lives and have much greater access to the services and consumer products bought by billionaires.

Crime: Socio-Economic vs IQ – The Bell Curve

It’s here, the last chapter comparison between the impact of the socioeconomic status of the family or the mother of the children and the IQ of the same.

I last posted on crime back in late July and then I mentioned:

When I picked up the book I was looking for books on “How to Raise Chickens” as a result of a post of mine some time back.  I saw the book on the shelves and was taken by the title.  I bought it and it was immediately relegated to my stack.  Some time later, Boortz was speaking about the author and I decided I better begin the book.  At this time I was still unaware of the controversy of the book.  Then I posted on it.  I was then made aware of the controversy.

As I mentioned then, I wasn’t aware of the massive controversy of the book.  I simply saw it on the shelf, bought it and then heard it referenced on the radio.  I started reading it and then posted on it.  Only later did I learn of that controversy.  And when I actually hit the big chapter, chapter 13, I understood why.

Now, as then, I won’t go further than chapter 12 [11 actually, I don’t find 12 interesting] and for the same reasons.  However, the controversy that surrounds the later sections of the book shouldn’t diminish the value that the first chapters deliver.

Now.  Crime.

The authors look to quantify crime in two ways:

  1. Asking if the man ever was engaged in criminal activity.
  2. Reporting if the man was interviewed in a correctional facility.

As they point out, both have weaknesses.  The self-reporting may not be accurate but does have the upside of capturing uncaught criminal activity.  The other has valid crime involvement but doesn’t capture criminals who haven’t been caught.  The “smart” ones.

The results are below:

And then:

In both cases, when controlling for other factors, the SES status of the family fades and becomes meaningless.  In fact, as SES increases so to does the rate of self reported crime.  And in both cases, a man possessing a low IQ is at significant risk for each category.