Category Archives: Welfare

Cost Of Raising A Child

For some reason as I was driving home yesterday, a thought occurred to me:

If one group of people paid $5.00 for a beer and another group of people paid $2.00 for a beer, would one group of people drink more beer than the other?

Or

If one group of people paid ~$200,000 to have a child and another group of people paid ~$0.00 to have a child, which group of people would have more children?

So, here I am looking at the data:

A middle-income family may spend $234,900 to raise a child born in 2011 to the age of 18, a 3.5 percent increase in a year, according to a government report.

That is a lot of money.  But the costs are not fixed:

The typical two-parent middle-income family spent $12,290 to $14,320 in 2011 on each child, the study found. Households that make less spend less, USDA researchers said. A family earning less than $59,410 a year will probably spend $169,080 in 2011 dollars to rear a child, while parents earning more than $102,870 may pay $389,670, according to the study.

And it can get worse than that.  According to this calculator the cost of raising a child can be as high as $434,180 if you earn more than $100k.

Earn less than $57,800 and you pay $133,710.  That’s $7,300 this year alone.

With government assistance to those poorest among us, that $7,300 can be completely covered reducing the real cost to near zero.

So, given the differences in the cost of raising children, I came to the conclusion that wealthy individuals have fewer children than do those less wealthy.

Was I right?  According to the Census I was:

The births per 1,000 women below 100% of the poverty line in 2008 was 96.3.  Births per 1,000 women above 200% of the poverty line that same year was almost exactly half : 47.7.

If income levels are pulled out, there is a steady climb in births per 1,000 from the wealthiest to the least wealthy.  A notable exception are the very poorest mothers:

Income Births Per 1,000
Less than $10,000. 33.7
$10,000 to $14,999. 103.8
$15,000 to $24,999. 86
$25,000 to $34,999. 80.3
$35,000 to $49,999. 72.3
$50,000 to $74,999. 64.4
$75,000 to $99,999. 57.4
$100,000 to $149,999. 51.8
$150,000 to $199,999. 49.3
$200,000 and over. 49.8

Certainly much more than the cost of raising a child goes into the decision of whether or not to have a baby.  Perhaps something as simple as the cost of contraception goes into the amount of pregnancies among the wealthy and the poor.  But it would be foolish to wave away the fact that the cost of raising a child is much higher for those who have more money and thus acts as a drag on the birthrate among that population.


Welfare: SES Impact – The Bell Curve

I’m continuing my series on the chapters of “The Bell Curve”, by Herrnstein and Murray.  If you are interested in the posts so far, just go to the category selections on the right sidebar, I’ve grouped them together under The Bell Curve.

So far we’ve taken a look at the impacts that the socioeconomic status of the parents of white women in the NLSY have on various life outcomes.  Included in those outcomes so far is poverty, education, Employment and the family.  This post deals with welfare and the dependency on welfare.

The first look at the impact of SES has welfare is what the probablity is of a white woman going on welfare within a year of her first birth.  The data presented below shows that probability with poverty and marital status  taken into account:

As probability of going on welfare moved from the poorest, about 28%, to the wealthiest, about 19%, the trend is down.  However, the authors report that the results are not statistically significant.

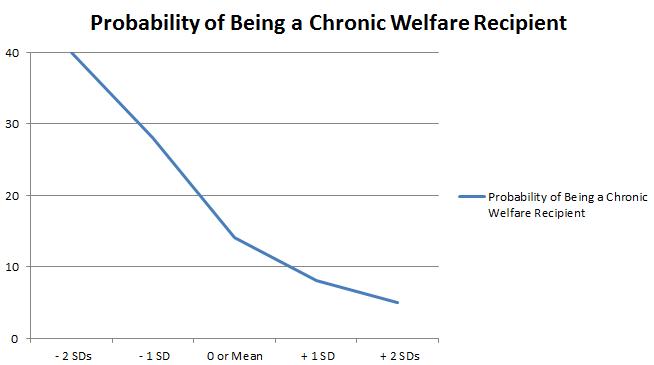
But another picture arises altogether when we look at chronic welfare recipients:


Here the results are dramatic.    The probability of a white woman in the NLSy study is greatly influenced by the socioeconomic status of her parents.  The authors don’t explain what might cause the change in the mild predictive value of SES in welfare at all vs. the highly predictive value that it plays in chronic welfare dependency.  However, they do hint that education plays a role somehow.

Why Do We Tax Those Whom We Tax?

I might be willing to agree that we should tax people according to their income.  I’d be less inclined to agree that we should increase the rate of taxation as the income moved ever higher.

However the debate went, I would insist on this:

Taxation of the people is meant to pay for the necessary role of government.

There is no way that you could get me to agree that we need to confiscate the wealth of one man and simply hand it to another.

Did I Mention That Obama Is A Liar – When A Tax Isn’t A Tax

Last night, in bitter disappointment, I posted that our President lied to us when he claimed that Obamacare wasn’t a tax.  Scott Erb and Nickgb called shenanigans.  The claim is that when Obama was claiming that his law wasn’t a tax, he believed it.  Only later did it turn out that he would be wrong and the court would strike down the law based on the commerce clause and uphold it under congresses ability to tax.

Certainly valid points.  But what is Obama’s administration saying now?

The White House and the Obama campaign today insisted that the individual mandate in the president’s health care bill is a “penalty,” not a tax, despite the Supreme Court’s ruling to uphold the law under Congress’ taxing power.

“For those who can afford health insurance but choose to remain uninsured, forcing the rest of us to pay for their care, a penalty is administered as part of the Affordable Care Act,” White House Press Secretary Jay Carney told reporters aboard Air Force One today.

“You can call it what you want. If you read the opinion, it is not a broad-based tax,” he said, stressing that the “penalty” would affect 1 percent of the population, based on CBO estimates. “It’s a penalty because you have a choice. You don’t have a choice to pay your taxes, right?”

Obama isn’t going to call this a tax.  It IS a tax, that’s the law.  As he sends his administration and his campaign out saying that it isn’t it does two things:

  1. That Obama knew this was a tax when he was working to pass this law.  The words know and the words then certainly are beginning to sound the same.
  2. That he’s lying now.

It’s settled.  This new law is a tax hike, rumor has it it’s the biggest tax hike in history.  In that lens , Obama is going to have to answer to that.

Incentives Matter: The Nanny State

Don’t think that incentives matter?

Don’t think that government programs that enlarge the nanny state don’t result in poor behavior?

Think again.

Continue reading

The Impact Of Marriage: Poverty And Children

I have been making the point that one of the contributors to poverty, income disparity and perhaps income mobility is marriage.  I’ve been making the case that marriage tends to bring people out of poverty and failing to get married tends to make one more likely to experience poverty.

For example, I’ve demonstrated that the GINI, or disparity in income, falls as the marriage rate increases in a population:

  • 50% Marriage:  .3446
  • 60% Marriage:  .3353
  • 70% Marriage:  .3227
  • 80% Marriage:  .3015

As the marriage rate went up, the GINI went down.  In other words, as my population increased its marriage rate the inequality diminished.  In fact, by moving from a 50% marriage rate to an 80% rate, the GINI moved by 12%.

Let’s do it again.  10,000 new salaries, same constraints:

  • 50% Marriage:  .3471
  • 60% Marriage:  .3416
  • 70% Marriage:  .3248
  • 80% Marriage:  .3093

Again, a continuing trend toward equality.

As the population marries, the GINI falls.  And this is just a mathematical observation, it has nothing to do with the social benefits that occur due to marriage.

Further, data from the Urban Institute and American University shows that marriage impacts poverty in more concrete ways:

The gains from marriage extend to material hardship as well. About 30 percent of cohabiting couples and 33-35 percent of single parents stated that sometime in the past year they did not meet their essential expenses. These levels are twice the 15 percent rate experienced by married parents. Even among households with similar incomes, demographic and educational characteristics, married couples suffer fewer serious material 21 hardships. Moreover, despite their less promising marriage market, low-income and less educated mothers who are married experience significantly less material hardship than low income,
less-educated mothers not married.

Marriage retained an advantage in limiting hardship even among families with the same incomes relative to needs. The variables used for controlling for the effect of income to-needs ratios were the income-to-needs ratios in the current wave of SIPP (the prior four month period) as well as the mean level and the stability of income-to-needs ratios during the 28 months prior to the current wave. Not surprisingly, higher current welfare ratios, higher past welfare ratios, and lower instability of welfare ratios were all associated with less hardship. However, the inclusion of the income variables left intact virtually all of the differences by marital and family status.

Families that fit in the same income that are married fare better than families that are not married.

The other day I posted on poverty and how to avoid it.  One of the key barriers to middle class is not getting married:


The Immediate Prerequisites to Success Are:

  1. Receive a good education [graduate high school]
  2. Work full time
  3. Marry [And do it before having kids]

But do we have data?  Have we been able to demonstrate that marriage is a determining factor?

Yes.  There is data that backs up the idea that marriage, and just marriage, would reduce our poverty rate significantly:

Economists Isabel Sawhill of Brookings and Adam Thomas of Harvard have conducted a fascinating analysis of whether higher marriage rates would reduce poverty in the United States.4 Employing statistical modeling, they analyzed data from the Census Bureau to determine how poverty would be affected if poor people behaved differently. In particular, they modeled the effect on poverty rates of more work, more marriage, more education, and fewer children by poor adults. In the case of marriage, they simply matched unmarried people by age, education, and race until the marriage rate for the nation equaled the marriage rate in 1970. This exercise showed that if we could turn back the clock and achieve the marriage rate that prevailed in 1970, poverty would be reduced by well over 25 percent.

Impressive indeed.  Simply returning to 1970 rates of marriage, we would be able to realize a significant improvement in our poverty numbers.  And to put this in perspective, social welfare programs aren’t even close when it comes to effectiveness:

By way of comparison, doubling cash welfare would reduce poverty by less than one-third as much as increasing marriage rates.

We could double spending and reduce  poverty.  But it would only be one-third as effective as getting people to get married.

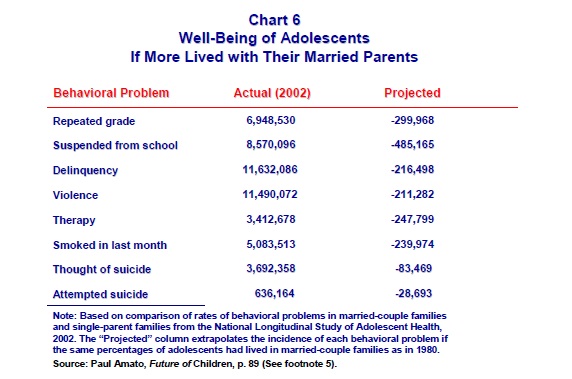
And as a way of comparison, look at the impact of poverty on kids and what reducing that impact by getting married would do:

Marriage, and the declining marriage rate, is a key to poverty in the United States.

A Him

Let’s get one thing clear.

  1. I care for the people less fortunate.
  2. The government has no role in that caring.

Okay, that’s two, but the second is important.  The government has a role.  And that role is to act as the referee in disputes.  It is to make sure that we all face the same rules and laws.  Sure, there is a cost in maintaining a government, so we tax to pay for it.  But that role of government is not meant to take money from those who have it and just flat out GIVE it to those who don’t.

When that role is given to the government, bad things happen.  Really bad things.

Continue reading

School Choice: Now You See It Now You Don’t

So, the United States isn’t doing so well educating our kids:

Scores from the 2009 Programme for International Student Assessment to be released Tuesday show 15-year-old students in the U.S. performing about average in reading and science, and below average in math. Out of 34 countries, the U.S. ranked 14th in reading, 17th in science and 25th in math.

And, on top of delivering horrible results, we’re spending more money than ever while watching our performance lag:

…with the exception of Switzerland, the United States spends more than any other country on education, an average of $91,700 per student between the ages of six and fifteen.

That’s not only more than other countries spend but it is also more than better achieving countries spend – the United States spends a third more than Finland, a country that consistently ranks near the top in science, reading, and math testing.

This isn’t new.  We’ve known this for a long time now.  And, just as long as we’ve been watching spending go up and achievement go down, we’ve been debating how to change one or both of those trajectories.  And of all those debates, few have been more contentious than all the others.  That subject?  That topic?

Choice.

Continue reading

Beware The Government Official Who Is Here To Help

There is nothing government can do to help.

Government, in it’s purest form is a concept rooted in “negative liberty“.  That is:

Negative liberty is defined as freedom from interference by other people…

That is, Liberty is best defined as that state found when living alone, on that “deserted island” where no man can take or demand.

On that island, a man is free and owns his liberty.

If, in the course of living, another should try to take from him his liberty, he is within “justice” to defend his self, his property and his life.

Government is nothing more than the collective acting as the individual in saying, you may not do this thing.

So be careful when the government comes to you offering you help.

Continue reading

Why Politicians are Bad for Politics

Because it’s hard for a person who wants to get elected to tell the people doing the electing that they need to suck it up.

While I’ve only been politically jazzed for 2-3 years now I have always wondered how “other people” vote.  You know, do they vote for what’s good for them and them only or do they vote for the better of “the system”.

For example, if a road is going to run through my backyard means I lose my house but it’s good for the community, should I vote for it or against it.

Can you imagine how different a father would discipline his children if they could somehow “vote him out”?  The only reason we successfully raise our children is that we create rules that they otherwise would not generally abide.

Same for politics.

Continue reading