Category Archives: Economics

Money and Happiness: This Should Surprise No One

Money Happiness

An interesting chart from The Economist:

THE Easterlin paradox, named for economist Richard Easterlin, reckons that higher incomes do not necessarily make people happier. Since Mr Easterlin first made his conjecture in 1974, economists’ views have evolved: money matters, studies suggest, but only up to a point. Become rich enough, and a bigger paycheque no longer leads to more happiness. Yet a new NBER working paper by economists Betsey Stevenson and Justin Wolfers, both of the University of Michigan, casts doubt on this chestnut. They use a trove of data generated by Gallup, a polling firm, from its World Poll. Gallup asked respondents around the world to imagine a “satisfaction ladder” in which the top step represents a respondent’s best possible life. Those being polled are then asked where on the ladder they stand (from zero to a maximum of 10), and how much they earn. Though some countries seem happier than others, people everywhere report more satisfaction as they grow richer. Even more striking, the relationship between income and happiness hardly changes as incomes rise. Moving from rich to richer seems to raise happiness just as much as moving from poor to less poor. One never really grows tired of earning more.

Prom Spending

Money

From all the Facebook posts I’ve been seeing, Prom Season is here.

It’s always fun to read the Visa Prom Report:

FOSTER CITY, Calif., April 24, 2013 /PRNewswire/ — Spending on the annual high school ritual of the prom continues to outpace inflation and grew for the second straight year, hitting an average of $1,139 per family in 2013, results from a new survey released today by Visa Inc. show. That represents an increase of 5% from the $1,078 that American families who have a teenager attending a prom spent on all aspects of the dance in 2012.

Full Disclosure:  I didn’t go to either my Jr. Prom or my Sr. Prom.  I’m a geek and I know it.

That said, $1,139 is an ENORMOUS amount of money to spend on one night.  And that’s only each HAL of the date.  I’m assuming the other half spends the same!  That makes the one night date a $2,278 affair.

Jeepers.

But this is what caught my eye:

One troubling statistic is that parents surveyed who fell in the lower income brackets (less than $50,000 a year) plan to spend more than the national average, $1,245, while parents who make over $50,000 will spend an average of $1,129.

What the what?

But that’s not all:

Additionally, single parents plan to spend $1,563, almost double the amount that married parents plan to spend at $770.

Why would single parents spend more on a Prom than married parents?  And given that single parent households are disproportionately less wealthy, what does that say about the decision making of single parent households?

Wherein Slate Agrees Minimum Wage Is Silly

minimum wageMinimum wage and minimum wage laws.  The creation of a system that forces employers to engage in charity by compensating someone more than their production would warrant.

Without getting into the concept that implementation of minimum wage laws, with the noble intention of helping out marginal employees, which hurt the very folks they are trying to help, let us suffice it to say that even Slate understands the economics of the whole thing:

I’m relatively bullish on the American economy, but I do worry that the prolonged downturn has created some odd mental blocks among American CEOs. Today, for example, the Wall Street Journal has a long story about how even though McDonald’s did fairly well at the depths of the recession they’re now having problems with the quality of the customer service they provide. I’m no management genius, but even I know that how much you pay people is relevant to how demanding you can be about the quality of the work they do.

And the converse is also true- how much you can earn is relevant to how demanding you are about the quality of your work.

And it continues:

Part of what you’re seeing here is that the prolonged weak labor market has in some ways been a sweet ride for managers. As things bounce back, it gets tougher. You might need to add staff. And to add high-quality staff you might need to offer better wages and working conditions.

Exactly!

This is why attorneys are paid more than gas station attendants.

The Birth Of The Next Housing Crisis – Day One?

Contagion

I’m not sure that we’ll have another housing bubble burst soon, or even in my lifetime.  But I’m sure that if we do, the genesis of that bubble will begin like this:

 The Obama administration is engaged in a broad push to make more home loans available to people with weaker credit, an effort that officials say will help power the economic recovery but that skeptics say could open the door to the risky lending that caused the housing crash in the first place.

President Obama’s economic advisers and outside experts say the nation’s much-celebrated housing rebound is leaving too many people behind, including young people looking to buy their first homes and individuals with credit records weakened by the recession.

In response, administration officials say they are working to get banks to lend to a wider range of borrowers by taking advantage of taxpayer-backed programs — including those offered by the Federal Housing Administration — that insure home loans against default.

The best of intentions, to be sure.  But the beginnings of a potential housing contagion.

And let’s not forget the associated racist dog whistle that accompanies these efforts:

“If you were going to tell people in low-income and moderate-income communities and communities of color there was a housing recovery, they would look at you as if you had two heads,” said John Taylor, president of the National Community Reinvestment Coalition, a nonprofit housing organization. “It is very difficult for people of low and moderate incomes to refinance or buy homes.”

And like past bad behavior, this time around the language surrounding the policy sounds good:

“I think the ability of newly formed households, which are more likely to have lower incomes or weaker credit scores, to access the mortgage market will make a big difference in the shape of the recovery,” Duke said last month. “Economic improvement will cause household formation to increase, but if credit is hard to get, these will be rental rather than owner-occupied households.”

It’s a free stimulus!

However, to be fair, if this is Day One, then Day Zero occurred a long time ago:

Deciding which borrowers get loans might seem like something that should be left up to the private market. But since the financial crisis in 2008, the government has shaped most of the housing market, insuring between 80 percent and 90 percent of all new loans, according to the industry publication Inside Mortgage Finance. It has done so primarily through the Federal Housing Administration, which is part of the executive branch, and taxpayer-backed mortgage giants Fannie Mae and Freddie Mac, run by an independent regulator.

It’s the same song that got us into this mess, this is just a new stanza.


Joe Biden: Personal Wealth

Joe Biden

Second only to democrats coming out in support of gay marriage, all the rage in Washington is for officials to take a pay cut in support of government officials who may face a furlough.

Obama and several other cabinet members rushed this week to day they would turn back some of their salary to the U.S. Treasury as a gesture of solidarity with federal workers facing furloughs. So far, Secretary of State John Kerry, Attorney General Eric Holder, Defense Secretary Chuck Hagel, Treasury Secretary Jack Lew, and Homeland Security Secretary Janet Napolitano have all said publicly that they would be giving back portions of their $200,000 salaries.

A nice gesture, I have to admit.  Something that I think helps in regards to the optics of the whole situation.  However, Joe Biden isn’t all in, yet:

Others, like Biden, have said they will return a portion commiserate with the number of days their department’s employees are furloughed.

But Biden’s decision not to follow Obama’s lead and return a flat portion of his salary — and the possibility that nobody on the vice president’s staff will be furloughed — has already prompted speculation in the media that Biden was looking to sidestep the pay cut.

I think that there are two reasons for Biden holding onto his money – actually three:

  1. He’s a democrat.  And democrats don’t like to part with their money for charitable reasons.
  2. He rightly thinks that he’s earned the money and has a right to keep it.
  3. He doesn’t have a lot of money and so a $11k cut would hurt.

Actually, I suspect all three reasons contribute to Biden’s reluctance to subject himself to a voluntary tax, but The Hill takes the high road and points out that Joe isn’t independently wealthy:

Unlike some members of the Obama Cabinet, he is not independently wealthy.

Obama’s net worth is estimated at between $3 million and $8 million and Secretary of State John Kerry’s wealth is in the range of $200 million according to The Hill’s “50 wealthiest lawmakers: list.

Biden’s net worth in comparison, according to the Center for Responsive Politics, is around $230,000, an amount roughly equivalent to his annual salary.

When I first read that this afternoon I kinda nodded and was like, “yeah, that makes sense.  He should be expected to give up 5% of his net wealth in a show of support.”  However, it then hit me, how does a senator who makes north of $150,000 a year, and now a Vice President who makes north of $220,000 have a net worth of only $230,000?

How is that possible?

If this is true, it means that the Vice-President of The United States of America is almost living hand to mouth.

Fascinating.

The Cost Of Food In America

Food Consumption

The chart above, first posted at Carpe Diem, is an interesting snapshot of America.  We have the lowest food costs in the world.

Interesting threads in the comments.  I’d add that Household Compensation includes money spent as a result of various programs; food stamps et. al.

From the post:

Relative to our total household spending, Americans have the most affordable food on the planet — only 6.7% of the average US household budget goes to food consumed at home. European countries like Spain, France, Belgium, and Norway spend twice that amount on food as a share of total expenditures, and consumers in countries like Turkey, China, and Mexico spend three times as much of their household budgets on food as Americans (see full list of countries at the link above).

For America’s increasingly affordable food over time, which has also been the most affordable in the world as a share of household spending for many years, we can thank the innovation, technological advances, and ever-greater supply-chain and distributional efficiencies that drive America’s farming industry, which in turn drive down food prices relative to other goods and services and relative to our income.

Income Inequality Crisis in 16 Charts – Response Part I

16 Charts.2

There has been a constant dull roar regarding the meme of income inequality.  I often see it in blogs and news articles in left leaning publications.  Lately though, I’ve seen it hit my social media pages.  Last night I found the whole thing summed up in one article:

Now we are engaged in a great tug-of-war over a few points in the top tax rate in Washington. But even if the White House pulls hardest, it won’t amount to much of a victory for the long-suffering middle class. The sources of their income stagnation are too deep, too varied, and too long-term for Clinton-era tax rates to cure them.

“There is a huge amount of focus on progressive taxes in our policy world but progressive taxes are not much of a solution to this,” said Lawrence Mishel, president of the left-leaning Economic Policy Institute. “We need to get unemployment down rapidly. We need to greatly change our labor standards. We need to raise the minimum wage.”

He’s right: The middle class crisis — and its resulting income inequality — is the most important economic story of our time. There are a million ways to tell it, and here’s another: an annotated slide show, culled from the amazing 2012 edition of the State of Working America from EPI.

Thompson goes into an argument for the next 16-17 slides and discusses the usual suspects; wage gap, wealth distribution, distribution of stock market wealth and minimum wage.  There are some other pieces of data there to, but all the big ones were represented.

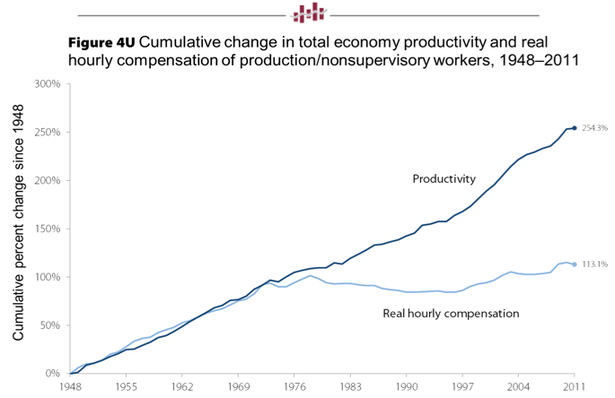
As I scrolled through, I just by chance grabbed the 2nd chart to investigate.  Thompson says:

Adding to the mystery is the remarkable de-coupling of productivity from real hourly compensation for all workers, including college graduates. The break seems to have occurred in the 1970s and accelerated very recently. Productivity grew steadily in the 2000s. Compensation didn’t.

I checked into what might have happened that would cause this de-coupling.  This is what I found:

The level of productivity doubled in the U.S. nonfarm business sector between 1970 and 2006. Wages, or more accurately total compensation per hour, increased at approximately the same annual rate during that period if nominal compensation is adjusted for inflation in the same way as the nominal output measure that is used to calculate productivity.

More specifically, the doubling of productivity since 1970 represented a 1.9 percent annual rate of increase. Real compensation per hour rose at 1.7 percent per year when nominal compensation is deflated using the same nonfarm business sector output price index.

In the more recent period between 2000 and 2007, productivity rose much more rapidly (2.9 percent a year) and compensation per hour rose nearly as fast (2.5 percent a year).

The relation between productivity and wages has been a source of substantial controversy, not only because of its inherent importance but also because of the conceptual measurement issues that arise in making the comparison.

Two principal measurement mistakes have led some analysts to conclude that the rise in labor income has not kept up with the growth in productivity. The first of these is a focus on wages rather than total compensation. Because of the rise in fringe benefits and other noncash payments, wages have not risen as rapidly as total compensation. It is important therefore to compare the productivity rise with the increase of total compensation rather than with the increase of the narrower measure of just wages and salaries.

The second measurement problem is the way in which nominal output and nominal compensation are converted to real values before making the comparison.   Although any consistent deflation of the two series of nominal values will show similar movements of productivity and compensation, it is misleading in this context to use two different deflators, one for measuring productivity and the other for measuring real compensation.

In short, compensation has, in fact, kept pace with productivity not lagged.  In fact:

Total employee compensation as a share of national income was 66 percent of national income in 1970 and 64 percent in 2006. This measure of the labor compensation share has been remarkably stable since the 1970s. It rose from an average of 62 percent in the decade of the 1960s to 66 percent in the decades of the 1970s and 1980s and then declined to 65 percent in the decade of the 1990s where it has again been from 2000 until the most recent quarter.

Again, when viewed as compensation and not the more simplistic wage, we are, to quote, remarkably stable” since the 1970’s.

But what happened in 1970’s that might change the way compensation was distributed?  Legislation:

During the 1970s, there were some important legislative and legal changes affecting compensation and workplace issues. Among the most important were the Employee Retirement Income Security Act of 1974 (ERISA) and the Revenue Act of 1978. ERISA regulated private pensions and imposed financial and accounting controls. ERISA also established the Pension Benefit Guaranty Corporation to ensure that workers would be paid their vested pension benefits, if their pension plans were terminated. The Revenue Act encouraged flexible benefit plans, and created the 401(k) defined contribution retirement savings plan. It also allowed employees to make elective pre-tax contributions to a variety of savings vehicles, such as saving, profit sharing, and employee stock ownership plans. In retrospect, these laws were extremely important, as they contributed to the change in the share of compensation accounted for by pensions and other retirement benefits.

Other important legislation that affected active and retired workers without necessarily affecting compensation directly included the Occupational Safety and Health Act of 1970, which authorized the Secretary of Labor to establish occupational safety and health standards in the workplace; the Comprehensive Employment Training Act of 1973, which consolidated and decentralized Federal employment programs and provided funds to State and local governments who sponsored employment services; and the 1974 amendment to the Social Security Act, which provides automatic cost-of-living adjustments, based on the Bureau’s Consumer Price Index.

The below chart shows what has happened over the twenty year period from 1966 to 1986:

16 Charts.2a

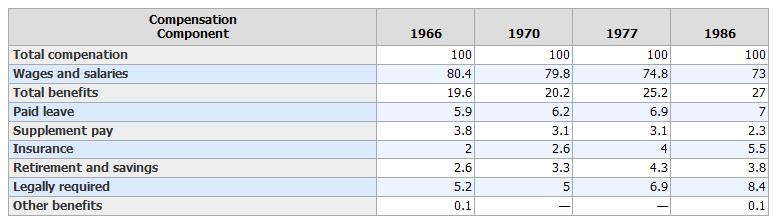
Just in those 20 years, cash money took a nearly 10% hit in the ratio of compensation.  Keeping that compensation constant, there should be little surprise that wages have fallen in proportion to productivity.

It turns out that Thompson’s analysis of the data depicted in that chart is incorrect, or misleading.  Employees are being compensated nearly the same since at least 1970.


Stealing Via The Government

Public Housing

If you want something but would rather not pay for it you can:

  1.  Hope that someone will give it to you.
  2. Elect politicians who will pass laws that gives it to you.

Granted, that’s the cynical take on the process but it does present what is occurring economically.  Consider housing:

The authority, landlord to more than 400,000 residents, has a backlog of about 350,000 repair orders. It also has a waiting list of 160,000 families.

The reason for this phenomena?  Greedy landlords or slum lords?  Hardly:

The eight projects, with a combined population of more than 25,000 people, are Alfred E. Smith, Baruch, Campos Plaza, Fiorello LaGuardia and Meltzer in Lower Manhattan; Carver and Washington on the Upper East Side; and Douglass on the Upper West Side.

Public housing all.

It’s simply economics.  When land is restricted by public use zoning laws, the price of real estate in general goes up.  And when the rent charged is limited by laws attempting to break the laws of economics, the quality of available housing goes down.  Represented her by budget shortfalls, backlogs of repairs and waiting lists.

The only natural remedy?

But soon, that patch of asphalt at the Alfred E. Smith Houses could be replaced by market-rate apartment buildings.

The New York City Housing Authority, facing one of the most serious financial shortfalls in its history, is for the first time making a major push to lease open land on the grounds of its housing projects to developers to generate revenue.

The authority wants to raise more than $50 million a year on long-term leases for parks, courtyards, parking lots, playgrounds and other property, seeking to address a $6 billion backlog of repairs.

The only thing that makes sense; open the land available to market forces and raise revenues.

Are The Poor Getting Poorer While The Rich Get Richer?

Poor

I suspect the charge has been leveled for as long as anyone can remember:

The rich are getting richer at the expense of the poor who are only getting poorer.

But is it true?

As with all things, it depends on how you measure it.

The White House Favors Moving Cell Phones Out Of Reach For Poor Americans

Cell Phone

Obama’s White House has an online petition process whereby any petition submitted that obtains 25,000 signatures or more will be guaranteed a response by the White House.  Recently, just such a petition hit more than 100,000 signatures:

The Librarian of Congress decided in October 2012 that unlocking of cell phones would be removed from the exceptions to the DMCA.

As of January 26, consumers will no longer be able unlock their phones for use on a different network without carrier permission, even after their contract has expired.

Consumers will be forced to pay exorbitant roaming fees to make calls while traveling abroad. It reduces consumer choice, and decreases the resale value of devices that consumers have paid for in full.

The Librarian noted that carriers are offering more unlocked phones at present, but the great majority of phones sold are still locked.

We ask that the White House ask the Librarian of Congress to rescind this decision, and failing that, champion a bill that makes unlocking permanently legal.

The petition, on its face, is fine.  However, one thing that it left out was the impact of just such a ruling would mean.

Today, cell phone operators subsidize cell phone purchases in exchange for a contract that locks the customer in for a predetermined amount of time.  This subsidy, often in the hundreds of dollars, allows for customers to obtain these phones very cheap or, in some cases, free.  By allowing people to unlock their phone legally, the cell phone companies will have no incentive to subsidize their phones and will, as a result, force the customer to assume the full cost of the phone.

The result?  Normal folks are going to be faced with higher cell phone costs than they otherwise would be.