 I’ve been aware, politically aware, since about 2006 or 2007. That’s when an interesting tidbit caught my attention:
The 2008 Presidential election would be the first in a long time where neither a sitting President or Vice President would be running.
The race would be wide open. I began to pay attention, and I was hooked. And since then I have heard a steady dull roar about the fading middle class. I’ve heard that the richest among us have been getting richer while the rest of us have experienced wages that remain flat.
The world would have us believe that for most of us, wages have experienced stagnation.
Is it true?
As it turns out, it may not be.
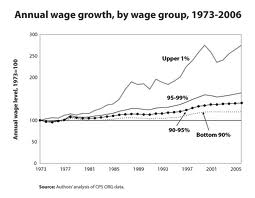
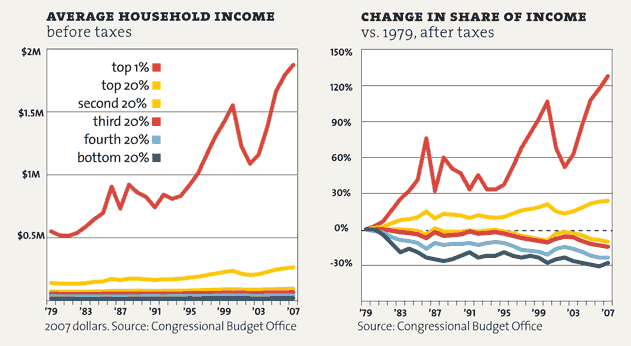
First, what is the claim. From what I can understand, the claim is that since the 70’s or the 80’s, income has flat lined for all of us not the 1%. The real #Occupy has been around for years now. The data is presented below:
Here we see that the top 1% have experienced massive income gains while most of the rest of us have seen income declines. It would seem that this data from the CBO is backed up by the Minneapolis Federal Reserve Bank:
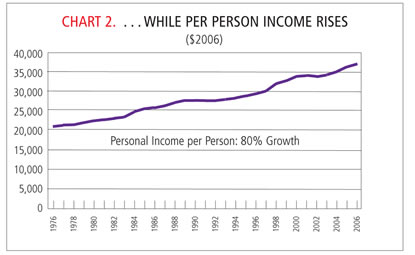
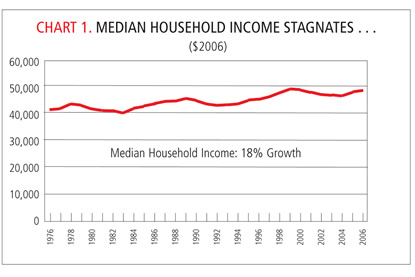 This graph is a little better, it displays the data in a better scale. However, the story is consistent; income has remained flat and has been this way for 30 years. But what happens when you plot income per PERSON rather than income per HOUSEHOLD?
The story changes. Rather than describing a scenario where income moves from just over $40,000 to just under $50,000, we see that income jumps from just over $20,000 to nearly $37,500. Rather than a disappointing 18% increase, the median individual sees an 80% INCREASE.
How is this possible? It’s possible due to a number of factors; the biggest being the makeup of the “household” has changed from the 70’s to today.
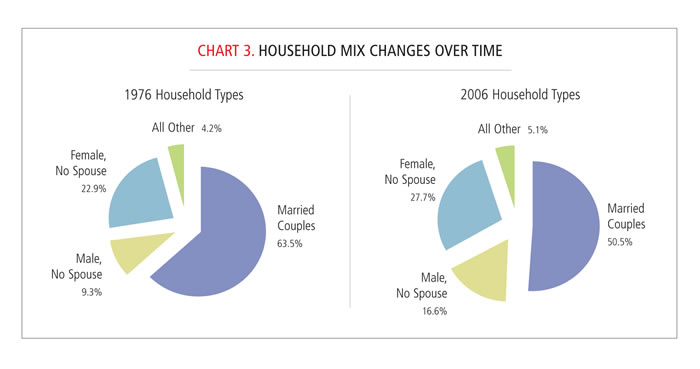 The percent of married families has gone from 63.5% in 1976 to 50.5% in 2006. That’s a drop of 13 percentage points or a 20% reduction. Is it any wonder that as our “households” become more and more single parent that we see the income of those households decrease?
In fact, if we break out households by type, we see significant growth in income:
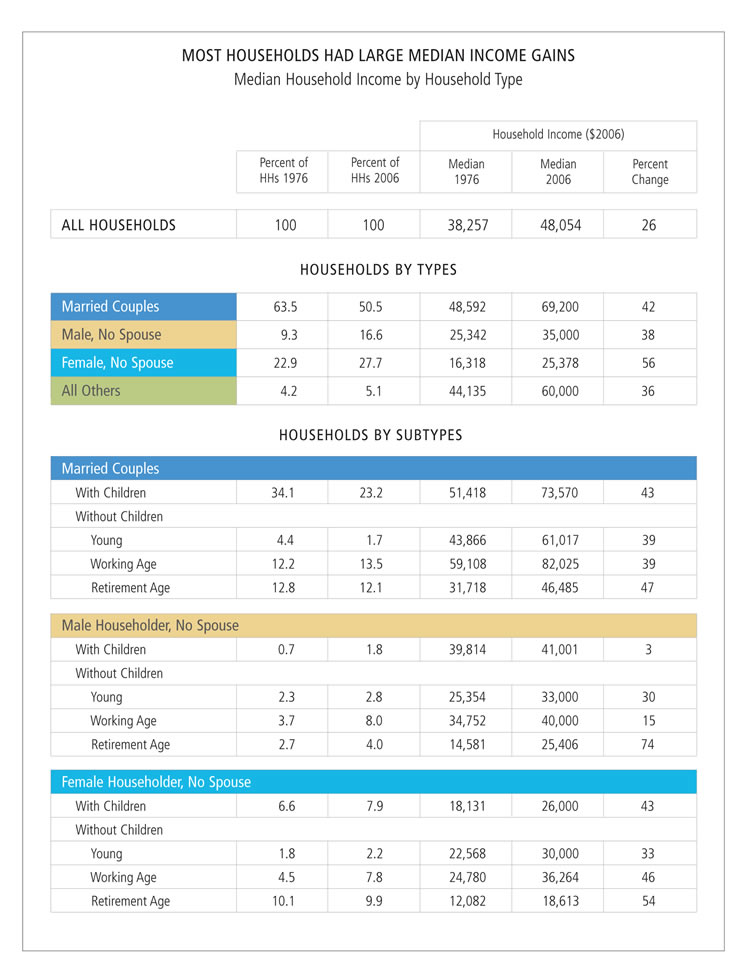 Far from the 18% advertised increase we routinely see increases of 30-40-50%.
And this doesn’t count the increase in non-monetary sources. The Minneapolis Federal Reserve Board explains:
The final step in calculating the income gains made by middle American households requires a closer look at differing definitions of “income.” The Census Bureau uses a narrow definition of income in its report on median household income that focuses on money income and excludes nonmonetary sources of income. The BEA, in contrast, defines personal income as income received from all sources. Examples of income excluded by the Census Bureau, but included by the BEA, are employer contributions to employee pension and insurance funds and in-kind transfer payments such as Medicaid, food stamps and energy assistance. These sources of income contribute to economic well-being and should be included in the definition of income.
And when this non-monetary source of income is included, what does the picture look like?
 It looks like the individual is doing quite well; to the tune of an 80% increase in the measured time period.
The conclusion reached by the Minneapolis Federal Reserve Bank?
The claim that the standard of living of middle Americans has stagnated over the past generation is common. An accompanying assertion is that virtually all income growth over the past three decades bypassed middle America and accrued almost entirely to the rich.
The findings reported here—and summarized in Chart 8—refute those claims. Careful analysis shows that the incomes of most types of middle American households have increased substantially over the past three decades. These results are consistent with recent research showing that the largest income increases occurred at the top end of the income distribution. But the outsized gains of the rich do not mean that middle America stagnated.
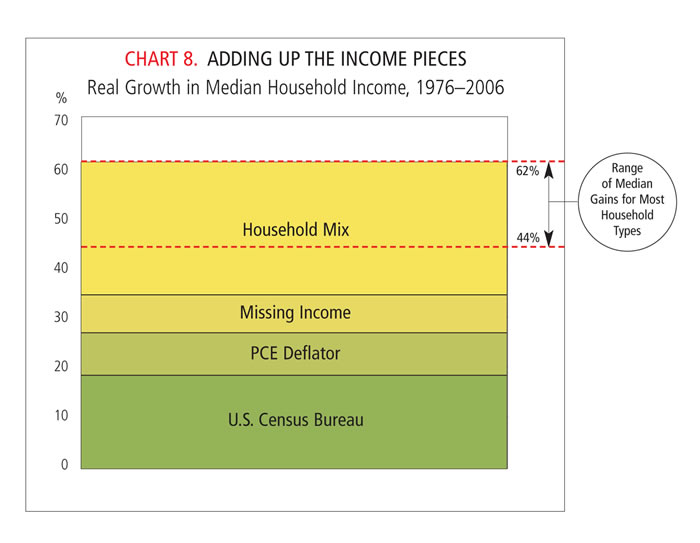 The whole paper is worth a read. But the fact is, the middle class is not seeing a stagnation of wealth; they are seeing a growth. and the perception being spread by media outlets today are simply not true.

Pingback: Are You Smarter Than A Three Year Old: Inequality and fairness | Tarheel Red