Tag Archives: Life Expectancy

Medical Intervention

When we measure a health care system, are we measuring the right things?  For example, consider heart attacks.  Is the best measure of a medical care delivery system one where we measure how many people survive a heart attack once it’s happened or is it one where we measure how many people have heart attacks?

I suggest that one measure is a reflection of societal norms.  The other medical care delivery.

With that said, do we measure the US system fairly?

Cancer Survival Rate

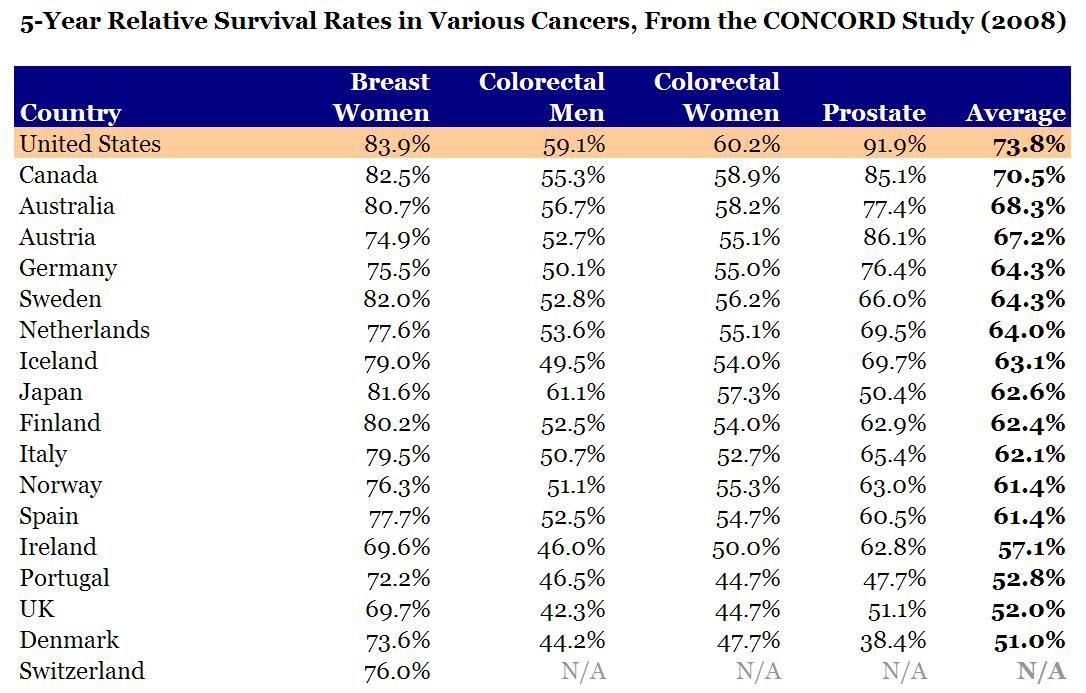
It’s not even very close, really.  And this plays out to what we know to be true – the world comes to America for medical care, not the other way around.

Sure – move to the ranch in Montana and you have less access to medical care.  But is tat the fault of the system or a feature?

But what about life expectancy?

Life Expectency

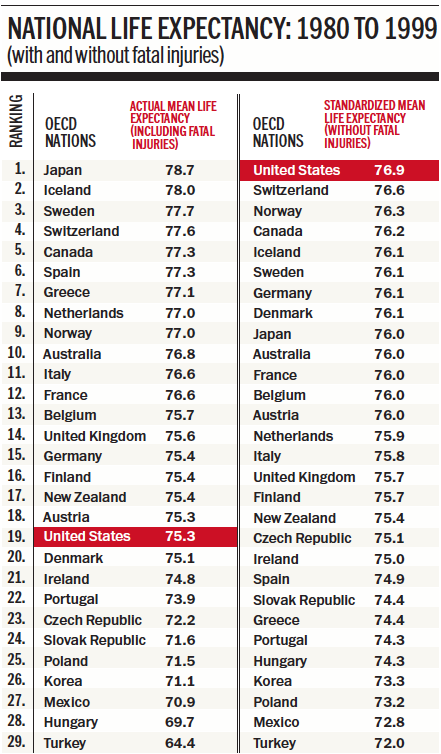
When fatal injuries are removed, which occur before medical care can be applied, the US moves from 19 to [ahem] 1.

Life Expectancy In The United States: We’re Number 1

A little while ago I posted that health care in America may be getting a bad rap.  That perhaps we might have the BEST system in the world, not the abysmal system that is often reported in the reports today:

The fact that America can deliver this service is a miracle in and of itself.  And the fact that we are such a wealthy nation that we can afford it is yet another miracle.

Now, to be sure, my case here is that our system is advanced and can be expensive.  However, we are a very wealthy nation and can afford the care.  However, in the comments, shenanigans was called and we discussed how the United States might be ranked #1, not #19-#29 or #47.

Continue reading

GINI: Income Mobility and Disparity

Much has been said during the last few years about income disparity.  And not just the disparity, but the mobility of people from one income group to another.

I’ve done some reading last night and this morning a thought struck me:

GINI measures the disparity in household income.  Consider Dick and Jane and their neighbors John and Mary.

Dick works in retail and is making $28,000 a year.  Jane works in service and makes $32,000 a year.

John works as a manager in a factory making $70,000.  Mary stays home and cares for their family.

The disparity between Dick and Jane vs. John and Mary is low.  Dick and Jane earn $60,000 a year while John and Mary earn $70,000.

Now, consider Dick and Jane get divorced.

The disparity between two households earning $28k and $32k compared to the one earning $70k is much higher, and the GINI goes up.  But nothing changed as far as economic earnings are concerned.  In fact, if you take this one step further, consider John and Mary also suffer divorce.  Now the incomes for FOUR households is:

  • $0
  • $28,000
  • $32,000
  • $70,000

A very disparate view when compared to the initial comparison of $60,000 and $70,000.

In the same way that the demographics of America impact life expectancy statistics [Japanese Americans live as long as native Japanese] I suspect that demographics impact the GINI.  I also suspect that this isn’t calculated into the analysis when people discuss the GINI.

That Whole Life Expectancy Thing?

Yeah…not so much.

It turns out that there are a number of problems in determining life expectancy numbers.  As I mentioned the other day, in some cases, nations aren’t reporting their “deaths” correctly.

And THAT could make a huge difference.

Continue reading

WHO: World Health Care Ranking

So, remember during the health care debate..that whole thing about America ranking like, what, 38th or some nonsense?

Well, remember, that ranking is determined by weighing several factors, among them are infant mortality statistics, availability of medical care and life expectancy.

Life Expectancy.  Seems fair, right?  I mean, what better way to measure your country’s medical/health care than to measure the single best outcome…how long a person lives.

And guess where America ranks?  Guess who’s #1?

Continue reading