Category Archives: The Bell Curve

The Family: SES Impact – The Bell Curve

I’m continuing my way through the book, “The Bell Curve” by Herrnstein and Murray.  I’ve posted already on several of the chapters describing the impact of the socioeconomic status of the families people come from.  Fascinating stuff.

The chapter next on the list deals with the family; specifically the family structure.  The chapter takes a look into what impacts how the family is formed and remains together, or not.

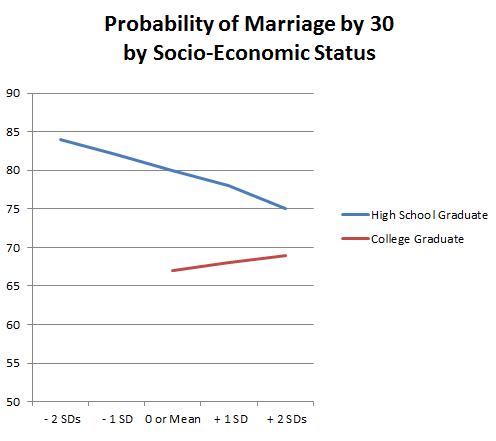
First, let’s take a look at marriage.  Specifically, marriage by the age of 30.  Marriage is very important in society and is critical in creating the building blocks that form successful family units.

So, how does the socioeconomic status of the parents impact the chance of marriage of the child?

The chart above shows data for white individuals in the study.

Because of the impact of education and its suppression on marriage, it’s useful to separate folks who have a high school diploma only from those who have a college diploma.  As you can see, socioeconomic status of the family of the individual has little impact on marriage.  Most people are married by 30 with an even higher percentage married by 40.

If marriage is important, then divorce is important as well.  After all, it’s the two parent home that’s critical to the success of ensuring kids gain a strong foothold in life.  And the data?

An interesting trend to be sure.  As family wealth increases, the rate of divorce increases as well.  Indeed, by the time we reach 2 standard deviations from the mean SES, the individuals are divorcing at 17 points higher than those on the lower SES end.  This represents a greater than 100% increase.

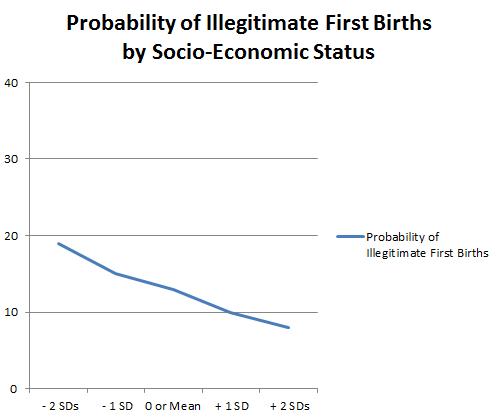
Here the conversation shifts from marriage and divorce without reference to children to those families formed outside of marriage.  And so enters the illegitimate child.  I tend to agree with the authors that the old-fashioned view of illegitimacy was that it occurred mostly at the lower ends of the socioeconomic scale.  It was “the poor girls” having babies out of wedlock, not the wealthy.

But does the data support that view?  The answer is kinda.


The women at the very end of the socioeconomic scale have illegitimate births at a 19% rate while the richest of women are giving birth about 8-9% before marriage.  The 10 points or so isn’t much, but again, does represent nearly a 100% increase in the rate comparing the very wealthy to the very poor.

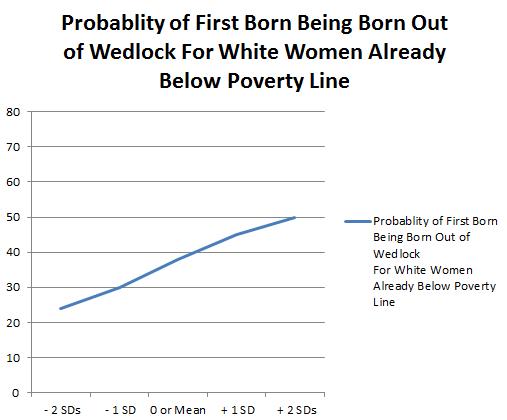
Here the authors move into an interesting question.  Does poverty cause illegitimacy or does the welfare system cause illegitimacy?  The idea, or the argument, being is that the welfare system enables the single mom to refrain from taking precautions that she might otherwise take if she were to bear the cost of raising the child.

To tease out an answer to this, an interesting question is asked:

Among NLSY white mothers who were at or below the poverty line in the year prior to giving birth, what proportion of the babies were born out of wedlock?  The answer is 44%.  For women above the poverty line?  6%.

What does the data, shown in the usual format, show us?

A pretty compelling argument that the wealth of the mother’s family plays a role.

Employment: SES Impact – The Bell Curve

I’ve been posting data that comes from the book “The Bell Curve” in a rather chapter by chapter format.  I started with Poverty and then moved to Education.  This post deals with Employment.

I should mention that the data discussed comes from a study the authors use throughout their book.  They have decided to use this data because of the size, scope and amount of relevant data points gathered.  That study is The National Longitudinal Survey of Youth [NLSY].

From the book:

The NLSY is a very large [12,686 persons], nationally representative sample of American youths aged 14-22 in 1979, when the study began, and have been followed ever since.

In the beginning chapters of the book, the authors use the NLSY extensively.  However, the work that they have done and the results being shown in these early chapters are the result of including only non-Latino whites in the analysis.  I’ll explain the authors reasoning in following posts – or you can go ahead and read it for yourself 😉

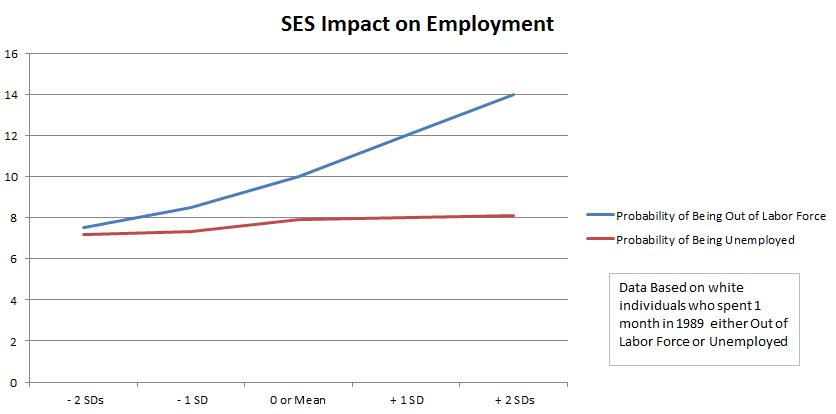
The next sets of data will show the impact that the socioeconomic status of the individual’s background has on employment and unemployment.  First, let’s take a look at the probability that an individual has of being out of the labor force for at least 1 month in 1989:

Interesting curve.  In all the data we’ve seen so far, the curve is to the advantage of the more wealthy households.  In this case, the probability of leaving the labor force goes up as a kid’s parent’s wealth grows. *

Now, let’s look at the same group of folks in the same year but instead of being out of the labor force, let’s measure unemployment:

Virtually straight.  It really doesn’t matter how wealthy your background is when predicting unemployment.

The impact of SES on the employment and/or unemployment of individuals is hard to gauge.  I’m guessing that with further context it’ll make more sense.

* The authors felt this was strange; I don’t.  Rich kids can afford not to work.

Update To Education

On Monday I posted on the impact of parental socioeconomic status as it pertains to their children’s educational outcomes.  In reviewing the post I failed to display 1 of 3 findings the authors made.  I think I did this because the data failed to demonstrate a point that I will be anxious to make in future posts regarding the book.

I will post now the data that speaks to kids who drop out of school only to later come back and earn their GED instead of obtaining a high school dipploma.  The graph is here:

As you can see, SES has a large impact on whether or not a child obtains a GED or stays in school to earn her high school diploma.  The wealthiest families generate graduates 9x more often than the poorest families of kids who drop out but come back to earn either their GED or diploma.

Education: Socioeconomic Impacts – The Bell Curve

Last week I posted on the impact that socioeconomic status had on childhood poverty.  I don’t think anyone was surprised to see that children who come from parents/mothers with a lower standard of living have a greater chance of growing up poor than children whose parents/mother had a higher standard of living:

The data is hard to argue with.  The “well off-ness” of the parents seems to have a powerful impact on the chance of poverty of a child.

The book continues this investigation as it relates to education, both high school and college.

First, the authors discuss high school and the rate of drop-outs.  That is, what is the probability of a kid finishing high school?  And they took a look at this through the lens of the socioeconomic status of the child’s parents.  Again, the scale is broken into 5 parts; the median is in the middle and from the center the scale moves on by 1 standard deviation and then another.

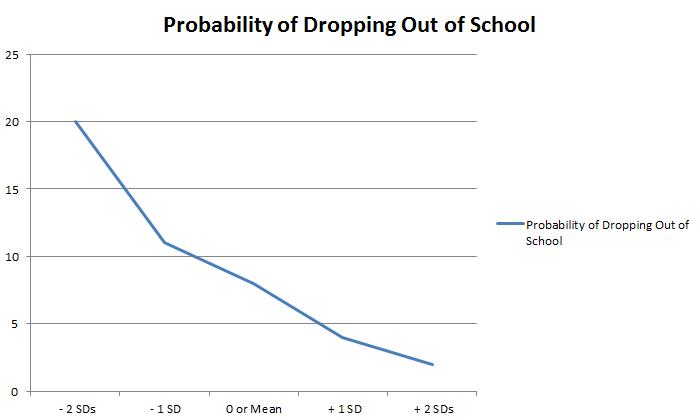
When everything else is held constant, the probability of dropping out of school based on the socioeconomic status of the parents looks like this:

The data is striking.  Kids from poorer households dropout of high school a very higher rates than kids from wealthier households.  If you look at the extremes, the poorest kids drop out at a rate ~10x as high as the kids from the wealthiest households.

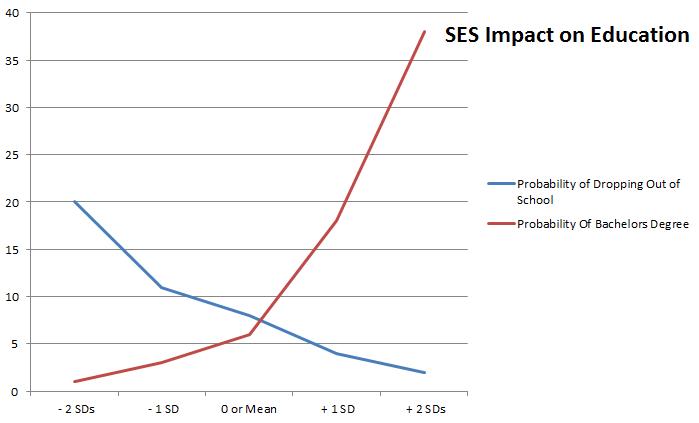
Now take a minute and consider college education and obtaining a 4 year degree.  Consider what you might expect the data to show.  If the data is consistent with our previous peeks into the impact that SES has on aspects of kids, we might make a pretty good guess.

Here’s the data:

Just as we might expect.  The role of the socioeconomic status of the parents is a powerful one for kids who wanna obtain a college degree.  Everything else being equal, there is almost no chance that a kid coming from the poorest families will achieve the the thrill of obtaining a diploma while the same kid from our wealthiest families has near a 40% of graduating.

As we close this section I’m struck by two things:

1.  Even our richest families are producing college graduates at a less than 40% clip.

2.  The wealth of a kids family continues to play a powerful role.

Poverty: Socioeconomic Impacts – The Bell Curve

I’m reading “The Bell Curve” and am finding the book fascinating.  As I mentioned in my previous post on this topic:

That attaining wealth is more and more becoming reserved for the pre-existing well to do’s.

For a long time I’ve fought this belief.  I’ve fought the idea that America is not the land of opportunity.  That we’ve somehow lost the idea that if you work hard enough you can do anything.

I’ve fought it.

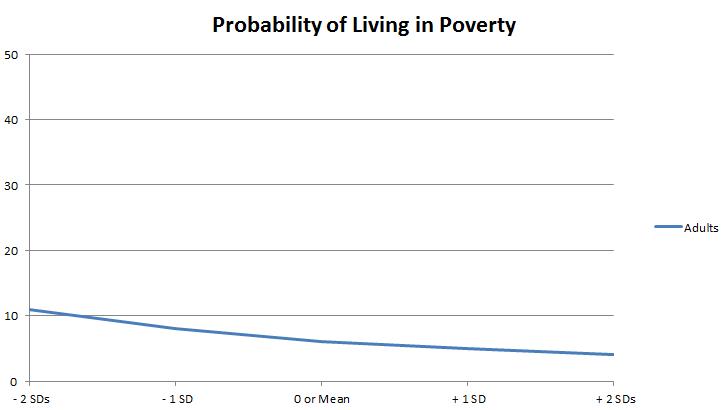
And now I’m reading a book, The Bell Curve, and I’ve seen some interesting data.  For example, it seems to be important where you come from if you wanna avoid poverty:

As I continue to make my way through the book, there is good data that reinforces the above statement.  Namely, where you come from, or who you are born to, impacts where you will end up.  Consider the white population:

I can only estimate the data above, the book doesn’t provide exact numbers, but you can see that as parental SES goes from 2 standard deviations below the mean to 2 standard deviations above the mean, the chance that an individual finds themselves in poverty is reduced.  In fact, if you look at the numbers, the families at the far poor end of the scale have almost three times the chance to produce poor children than the very well off families at the other end.

What if we dig deeper in the data?  What happens if we look at the probability that a child lives in poverty?  How does socioeconomic status impact that?

Well, it turns out that the data is divided.  For example, consider married white mothers:

Interesting.

It turns out that that being a married mother helps reduce the chance of childhood poverty.  Reduces but only slightly.  However, what is interesting is that the impact of a higher socioeconomic parent is magnified.  In the general public, a higher parental SES ranking meant that an adult had 1/3 the chance of ending up in poverty.  For children, it’s much more dramatic.

For a child, having parents in the lowest SES class means that poverty is ~5.5 times as likely than if that child came from parents in the highest SES rankings.  That is, kids from the most well of parents suffer poverty at rates of about 2%.  Kids from the least well off suffer poverty at rates of about 11%.

Now for the shocker.  Let’s look at single white mothers:

WOW!

Kids of white mothers that are either separated, divorced o r never married suffer massively higher rates of poverty than mothers of kids who are married.  But again, for the sake of this specific conversation, the socioeconomic ranking of the parents is meaningful.  Parents who rank at the very low end raise kids who have approximately a 39% chance of being in poverty.  Mothers who are in the top ranks of socioeconomic ranking?  Their kids only have about a 30% chance of living in poverty, almost a 33% less chance.

The data is hard to argue with.  The “well off-ness” of the parents seems to have a powerful impact on the chance of poverty of a child.


The Bell Curve


I’ve started another book.  I’m now reading “The Bell Curve” by the boys listed above.

Stats that struck me tonight:

Think of your twelve closest friends or colleagues.  For most readers of this book, a large majority of them will be college graduates.  Does it surprise you to learn that the odds of having even half of them be college graduates are only six in a thousand, if people are randomly paired off?  Many of you will not think it odd half or more of the dozen have advanced degrees.  But the odds against finding such a result among a randomly chosen group of twelve Americans are actually more than a million to one.

I am going to love this book!