I’ve been posting data that comes from the book “The Bell Curve” in a rather chapter by chapter format. I started with Poverty and then moved to Education. This post deals with Employment.
I should mention that the data discussed comes from a study the authors use throughout their book. They have decided to use this data because of the size, scope and amount of relevant data points gathered. That study is The National Longitudinal Survey of Youth [NLSY].
From the book:
The NLSY is a very large [12,686 persons], nationally representative sample of American youths aged 14-22 in 1979, when the study began, and have been followed ever since.
In the beginning chapters of the book, the authors use the NLSY extensively. However, the work that they have done and the results being shown in these early chapters are the result of including only non-Latino whites in the analysis. I’ll explain the authors reasoning in following posts – or you can go ahead and read it for yourself 😉
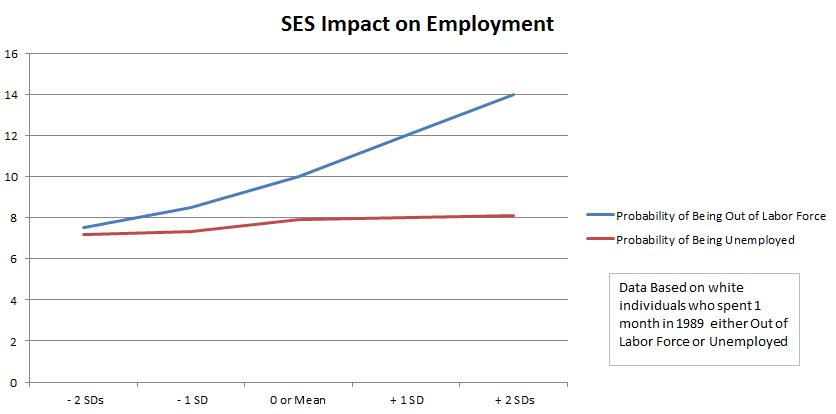
The next sets of data will show the impact that the socioeconomic status of the individual’s background has on employment and unemployment. First, let’s take a look at the probability that an individual has of being out of the labor force for at least 1 month in 1989:
Interesting curve. In all the data we’ve seen so far, the curve is to the advantage of the more wealthy households. In this case, the probability of leaving the labor force goes up as a kid’s parent’s wealth grows. *
Now, let’s look at the same group of folks in the same year but instead of being out of the labor force, let’s measure unemployment:
 Virtually straight. It really doesn’t matter how wealthy your background is when predicting unemployment.
The impact of SES on the employment and/or unemployment of individuals is hard to gauge. I’m guessing that with further context it’ll make more sense.
* The authors felt this was strange; I don’t. Rich kids can afford not to work.


